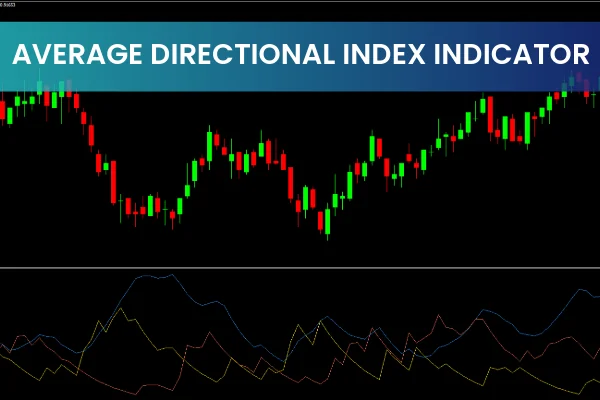
The Average Directional Index (ADX) Indicator is one of the most reliable technical analysis tools for identifying Trend Strength in any financial market. Whether you trade forex, stocks, commodities, or indices, the ADX helps determine whether a market is trending or moving sideways. By analyzing the relationship between +DI, –DI, and ADX values, traders can make better decisions about when to enter, stay in, or avoid trades altogether. This makes the ADX an essential indicator for trend-following strategies and market timing.
What Is the Average Directional Index Indicator?
Developed by J. Welles Wilder, the ADX was introduced in his book New Concepts in Technical Trading Systems. Although initially created for commodity markets, the indicator has proven useful across all asset classes.
The ADX consists of:
+DI (Positive Directional Indicator)
–DI (Negative Directional Indicator)
ADX line measuring trend strength
The indicator ranges from 0 to 100 and is non-directional, meaning it measures how strong the trend is—not whether it is bullish or bearish.
How ADX Values Are Interpreted
ADX below 20 → Weak or no trend
ADX above 25 → Strong trend present
ADX rising → Trend strength increasing
ADX falling → Trend losing momentum
This makes the ADX valuable when determining whether to apply a trend-following approach or switch to a range-bound strategy.
How to Use the Average Directional Index Indicator
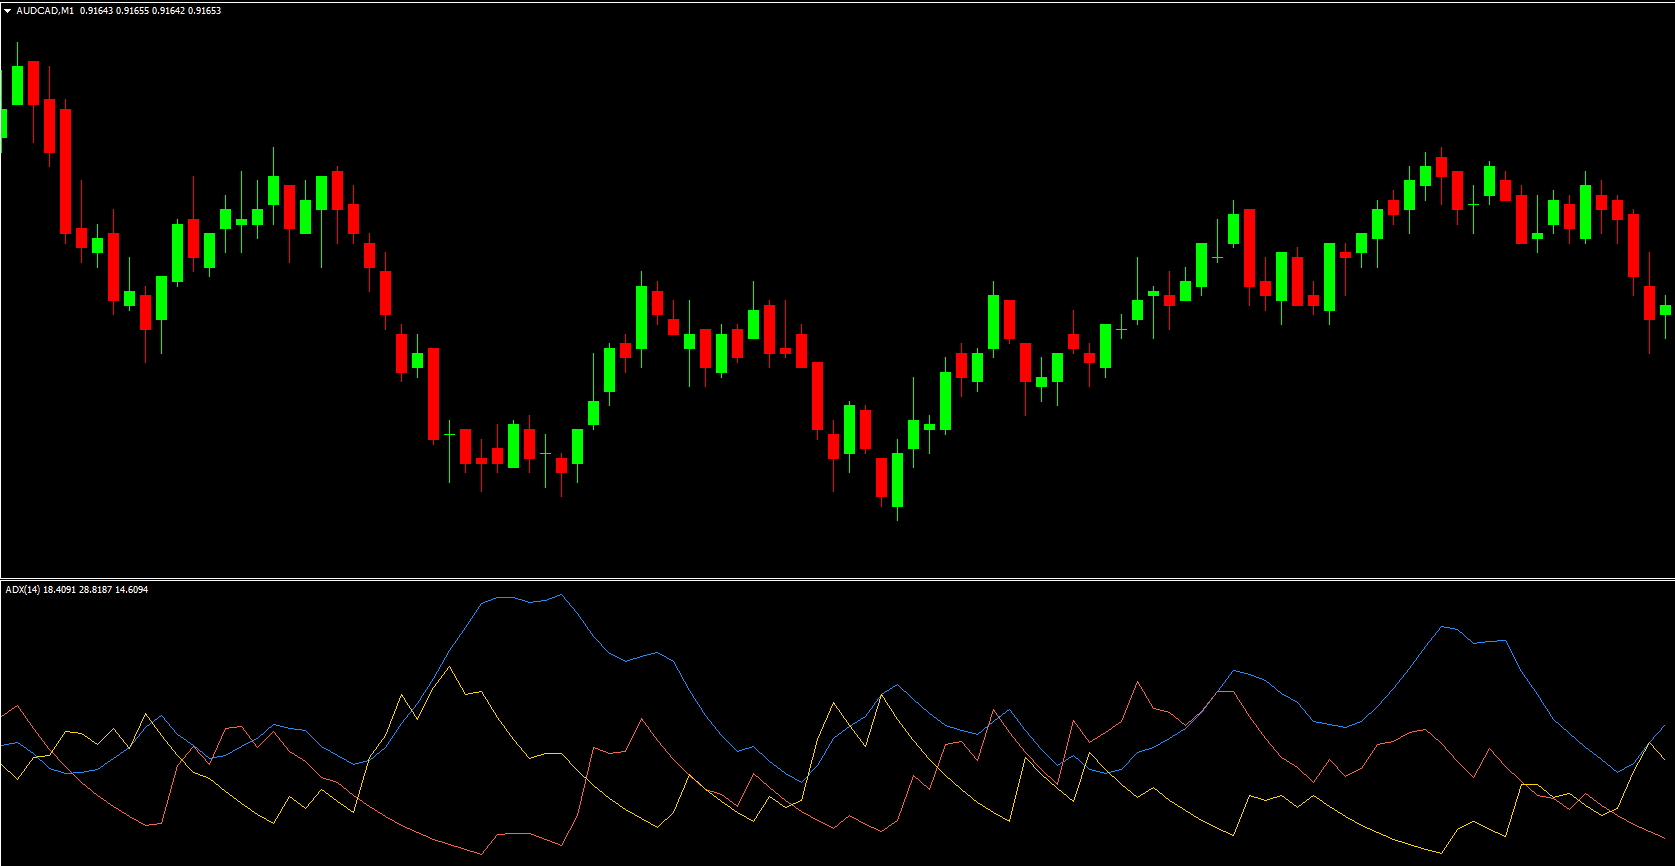
The primary purpose of the ADX is to determine the strength of a trend using the interaction between +DI and –DI.
+DI and –DI Crossovers
Crossover signals help traders spot potential BUY or SELL opportunities:
BUY signal: +DI crosses above –DI while ADX is above 25
SELL signal: –DI crosses above +DI while ADX is above 25
Crossovers without a strong ADX reading (below 20–25) are often unreliable and typically indicate a weak or choppy market.
Trend Strength and Market Conditions
Understanding trend strength helps traders choose better strategies:
In strong trends (ADX > 25), traders may use moving average systems or breakout methods.
In weak or sideways markets (ADX < 20), it may be better to avoid trend-based entries and use oscillators instead.
When ADX begins to fall from high levels, it signals the trend may be ending, giving traders time to manage exits or reduce risk.
ADX Buy Strategy
A typical long trade setup includes:
+DI crosses above –DI
ADX rises above 25, confirming trend strength
Wait for bullish Price Action (higher highs or bullish candles)
Place stop-loss near recent swing low
Exit when +DI dips below –DI or ADX begins to weaken
ADX Sell Strategy
For short trades:
–DI crosses above +DI
ADX rises above 25 to confirm strong downward momentum
Wait for bearish confirmation from price action
Set stop-loss near recent swing high
Exit when –DI falls back below +DI or trend strength decreases
Improving Results with ADX
Like any indicator, ADX should not be used alone. Combining it with other tools—such as moving averages, RSI, MACD, or price-action patterns—can significantly improve accuracy. ADX works best as a trend confirmation tool, helping traders avoid low-probability setups during weak market conditions.
Conclusion
The Average Directional Index (ADX) Indicator is a critical tool for identifying trend strength and improving trade timing. By analyzing +DI and –DI crossovers alongside ADX levels, traders can determine when markets are trending and when to stay out. For more powerful trading tools and free downloads, visit IndicatorForest.com and enhance your trading strategy today.
FAQ
Published:
Nov 15, 2025 00:37 AM
Category: