The Master Pattern Indicator by LuxAlgo is a cutting-edge Market Structure tool that detects one of the most influential behaviors in price action — the master pattern cycle, where contraction (low volatility) transitions into expansion (high volatility).
This indicator automatically pinpoints areas where price consolidates before a breakout, helping traders recognize compression zones, breakout directions, and liquidity levels above and below key structures. It’s a perfect addition for traders who use Smart Money Concepts (SMC), breakout trading, or liquidity-based strategies.
By mapping out contraction and expansion phases, the Master Pattern Indicator helps traders stay one step ahead of volatility — entering just before major moves unfold.
How the Master Pattern Indicator Works
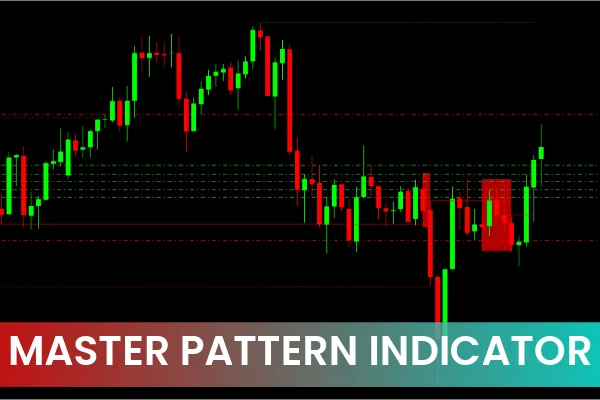
The LuxAlgo Master Pattern Indicator scans the chart for phases of contraction, where volatility tightens and price movement compresses. These zones are visually displayed as rectangular blocks or boxes on your chart.
Once the market breaks out of these contraction zones, the indicator confirms the direction of the breakout:
Bullish breakout: Highlighted when price breaks above the contraction range.
Bearish breakout: Highlighted when price breaks below the contraction range.
Additionally, the indicator identifies major and minor liquidity levels, allowing traders to anticipate potential stop hunts, mitigation areas, and take-profit zones.
This dynamic structure-based system effectively captures the natural rhythm of price — contraction, expansion, and new structural development.
Master Pattern Indicator Trading Signals
The Master Pattern Indicator doesn’t rely on lagging oscillators or moving averages. Instead, it delivers contextual trading signals derived from market structure and volatility cycles.
Bullish Breakout Setup
Price compresses into a tight contraction zone.
The indicator marks the zone and price breaks upward.
Liquidity levels above serve as potential targets or breakout confirmation zones.
Traders may look for entries just above the breakout or on a retest of the zone.
Bearish Breakout Setup
A contraction zone forms with decreasing volatility.
Price breaks downward below the range.
Liquidity levels beneath the structure mark potential profit targets or entry confirmation areas.
Liquidity Reaction Setup
After a breakout, price often revisits nearby liquidity pools.
These levels may act as reversal points or continuation zones, depending on the reaction.
By combining the contraction-to-expansion logic with LuxAlgo’s liquidity mapping, traders can identify high-probability breakout zones and plan entries before large moves.
Why Use the Master Pattern Indicator?
Detects Contraction and Expansion Cycles – Spot the critical transitions before volatility spikes.
Highlights Liquidity Levels – See where smart money positions and stops are located.
Directional Bias Visualization – Clearly shows bullish and bearish breakout bias.
Works on All Markets – Compatible with Forex, indices, stocks, and crypto.
Ideal for SMC & Breakout Traders – Integrates seamlessly with market structure and liquidity-based strategies.
How to Trade with the Master Pattern Indicator
Identify a Contraction Zone: Look for a compression block drawn by the indicator.
Wait for a Breakout: Confirm direction as price breaks above or below the range.
Validate Liquidity: Check for liquidity levels aligned with the breakout direction.
Plan Entry: Enter on the breakout candle or retest of the zone.
Set Stop-Loss: Just beyond the opposite side of the contraction zone.
Set Take-Profit: At or near the liquidity level or expansion completion.
Conclusion
The Master Pattern Indicator for MT5 by LuxAlgo is a powerful visualization tool that decodes one of the most important market structures — the cycle of contraction and expansion. By mapping these transitions and identifying liquidity targets, traders can time breakouts with greater accuracy and confidence.
Whether you’re a Smart Money Concepts trader or a Price Action breakout specialist, this indicator offers the clarity and precision needed to anticipate major market moves before they happen.
📥 Download the LuxAlgo Master Pattern Indicator for MT5 today from IndicatorForest.com and master the rhythm of market volatility.
FAQ
The Master Pattern Indicator detects the master pattern cycle where contraction (low volatility) transitions into expansion (high volatility). It automatically pinpoints areas where price consolidates before breakouts, helping traders recognize compression zones, breakout directions, and liquidity levels above and below key structures.
Identify a contraction zone marked by the indicator, wait for a breakout above or below the range, validate liquidity levels aligned with the breakout direction, and plan entry on the breakout candle or retest of the zone. Set stop-loss just beyond the opposite side of the contraction zone and take-profit at liquidity levels.
The indicator integrates seamlessly with Smart Money Concepts strategies by identifying liquidity levels where smart money positions and stops are located. It highlights contraction-to-expansion transitions that SMC traders use to anticipate major moves, making it perfect for liquidity-based trading approaches.
The indicator identifies major and minor liquidity levels, allowing traders to anticipate potential stop hunts, mitigation areas, and take-profit zones. After breakouts, price often revisits nearby liquidity pools, which may act as reversal points or continuation zones depending on the reaction.
Yes, the Master Pattern Indicator is compatible with Forex, indices, stocks, and crypto markets. It works on all timeframes and is ideal for SMC traders, breakout traders, and those using liquidity-based strategies who want to stay one step ahead of volatility.
3 Downloads
Published:
Nov 05, 2025 10:49 AM
Category: