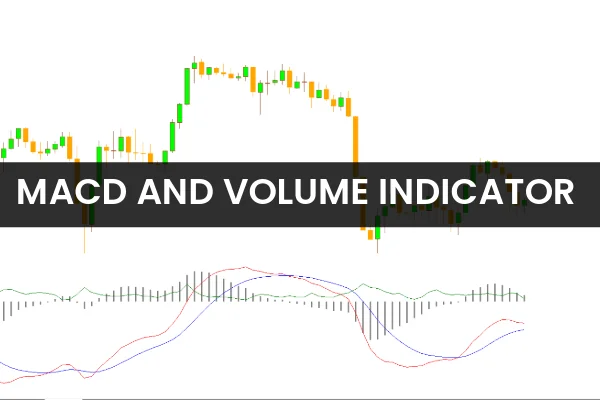
The MACD and Volume Indicator for MetaTrader 4 (MT4) is an upgraded version of the traditional MACD indicator, designed to improve trading accuracy by integrating volume analysis into the classic Moving Average Convergence Divergence (MACD) framework.
By combining momentum and volume strength, this indicator allows traders to validate trend signals more effectively. The additional volume confirmation helps distinguish genuine price momentum from weak or false market moves — a common challenge in volatile Forex conditions.
The MACD Volume Indicator for MT4 works well for Scalping, day trading, swing trading, and even long-term analysis, making it a versatile tool for both beginners and professional traders.
Understanding the MACD and Volume Indicator
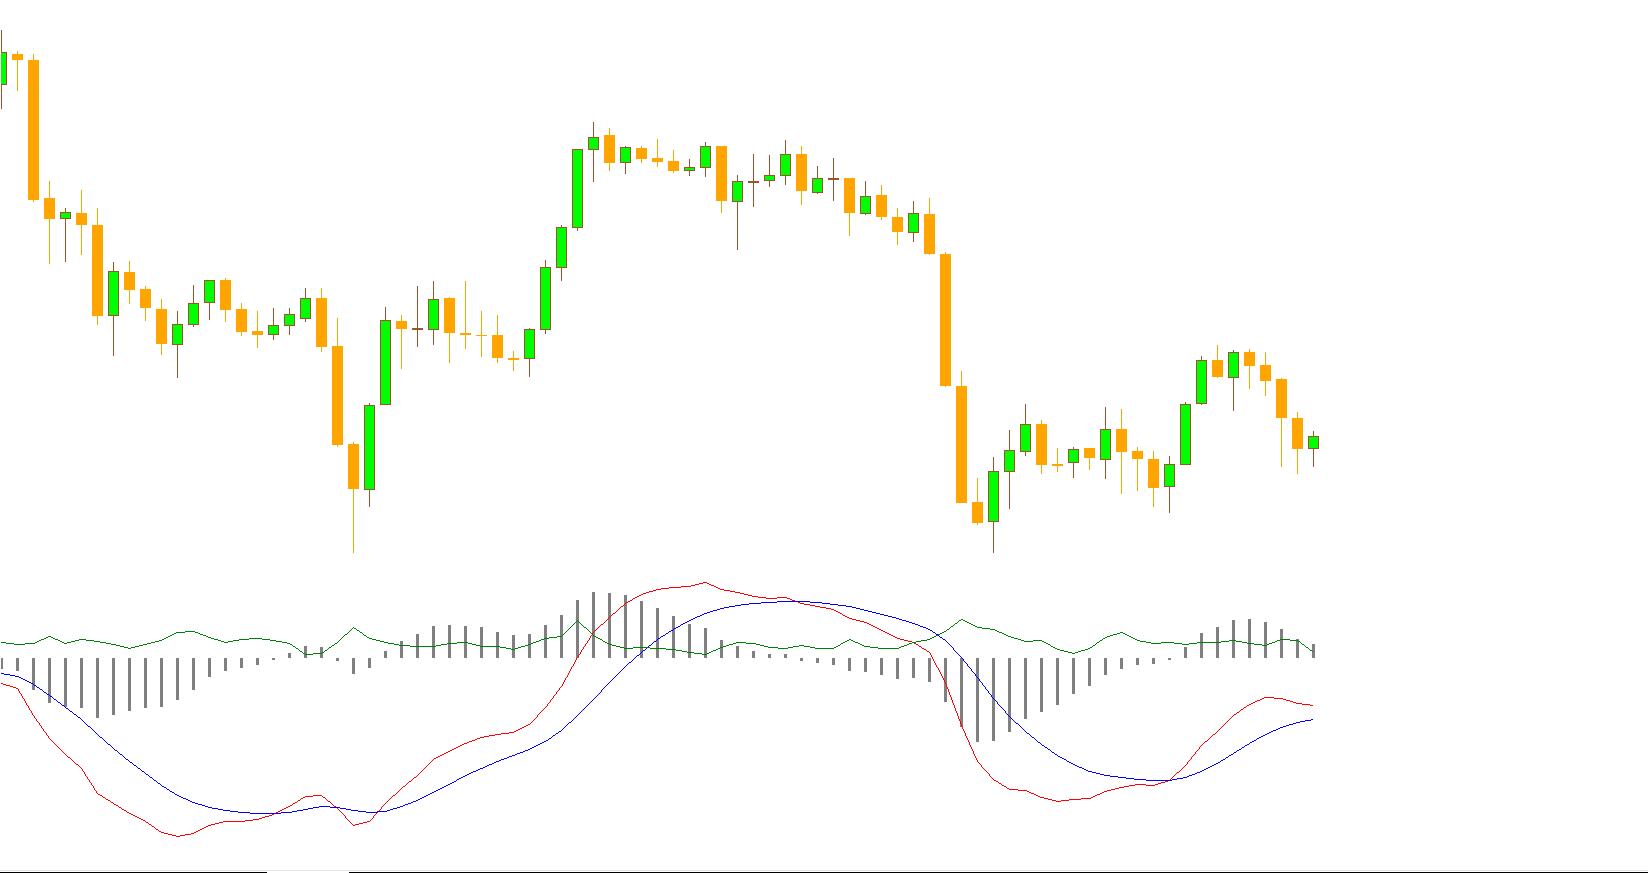
The traditional MACD indicator identifies the strength and direction of a trend by measuring the relationship between two moving averages — typically the 12-period and 26-period EMAs — and plotting a signal line (often a 9-period EMA).
However, the MACD and Volume Indicator enhances this concept by including real-time volume data, displayed as a green volume line, to show the intensity behind price movements.
This combination provides two critical insights:
Trend Direction: Determined by the MACD lines and histogram bars.
Market Strength: Confirmed by the volume line — higher volume often means stronger trends.
MACD and Volume Indicator for MT4 Trading Signals
Once installed, the MACD and Volume Indicator displays:
Grey histogram bars – representing the distance between the MACD and Signal lines.
Red and blue MACD lines – indicating bullish and bearish momentum shifts.
Green volume line – showing trader participation and Trend Strength.
Bullish Signal Setup
The MACD line crosses above the zero line.
Histogram bars rise above zero, showing positive momentum.
The green volume line trends upward, confirming strong buyer interest.
When these conditions align, a buy signal is confirmed. Traders can enter long positions with a stop loss below the previous swing low and aim for profits as momentum continues upward or until an opposite signal appears.
Bearish Signal Setup
The MACD line crosses below the zero line.
Histogram bars drop below zero, signaling downward momentum.
The green volume line declines, confirming reduced buying interest and strengthening bearish pressure.
A sell trade can be executed under these conditions, with stops placed above the latest swing high and profits taken when an opposite bullish crossover forms.
Volume-Based Confirmation Strategy
The green volume line plays a key role in filtering false signals.
When volume increases alongside the MACD trend, it validates momentum and increases confidence in the trade.
Conversely, low volume during a crossover indicates weak participation — a warning sign of possible consolidation or fake breakouts.
This dual confirmation strategy helps traders enter trades with stronger conviction and improved timing.
Why Use the MACD and Volume Indicator for MT4?
The MACD Volume Indicator offers several benefits that enhance trading accuracy:
Improved Trend Confirmation: Combines momentum and volume to confirm real trend strength.
Versatile Application: Suitable for all timeframes and trading styles — scalping, day trading, and swing trading.
Visual Clarity: Color-coded components make it easy to interpret market conditions at a glance.
Reduced False Signals: Volume data filters out weak or low-probability MACD crossovers.
Automation Ready: Can be integrated into automated trading strategies for algorithmic systems.
By aligning momentum and volume, traders can identify high-probability entries and minimize risk exposure in unpredictable markets.
How to Combine MACD and Volume with Other Indicators
While the MACD and Volume Indicator is powerful on its own, it performs even better when used with complementary tools:
Moving Averages (MA): Confirm trend direction on higher timeframes.
RSI (Relative Strength Index): Filter overbought or oversold conditions.
Bollinger Bands: Spot volatility expansions before major price moves.
For example, a bullish MACD crossover with rising volume and RSI below 60 often signals a strong uptrend continuation.
Conclusion
The MACD and Volume Indicator for MT4 is a dynamic tool that combines trend and volume analysis for precise Forex trading decisions. By adding volume to the classic MACD, traders can confirm buy and sell signals with higher confidence, filter out false trends, and improve trade timing.
Whether you’re trading short-term fluctuations or long-term swings, this indicator enhances your market insight and decision-making accuracy.
Download the MACD and Volume Indicator for MT4 today from IndicatorForest.com to elevate your trading performance with reliable trend and volume confirmation.
FAQ
1 Download
Published:
Nov 07, 2025 08:22 AM
Category: