Trend lines are a cornerstone of classical technical analysis, used by nearly all traders to identify market direction and potential reversals. However, drawing trend lines manually can be subjective and time-consuming — especially when you’re dealing with false breakouts, redrawing issues, or multiple possible trend line interpretations.

The Auto TrendLine MT4 Indicator eliminates this complexity by automatically drawing the most relevant and accurate trend lines on your chart. It filters out noise, focuses on key price points, and dynamically updates as market conditions change — helping both novice and experienced traders trade with confidence.
What Is the Auto TrendLine MT4 Indicator?
The Auto TrendLine Indicator for MetaTrader 4 identifies and plots valid trend lines automatically. It uses advanced mathematical algorithms and filters to highlight only those lines that are most significant and that the price is likely to interact with.
Unlike traditional methods that require manual adjustments, this indicator updates itself in real time as new highs or lows form, ensuring your analysis always reflects the current Market Structure.
Key Features:
Automatic detection of valid trend lines.
Dynamic updates when new price extremes form.
Solid and dotted lines to distinguish active and projected trends.
Non-repainting behavior – it updates without altering past data.
Clean visual presentation to reduce chart clutter.
How It Works
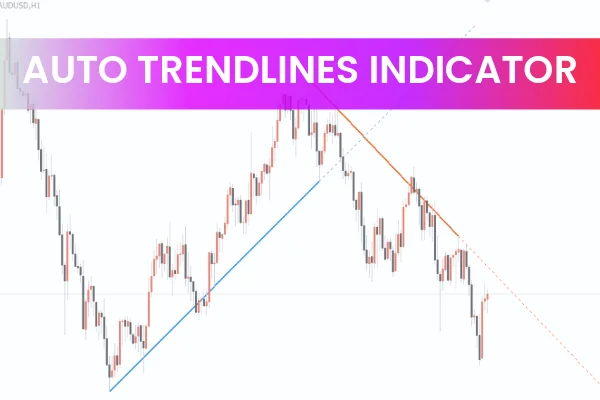
The indicator displays two primary trend lines — one for the uptrend and one for the downtrend. Each line includes two versions:
Blue solid line – current uptrend.
Blue dotted line – projected continuation of the uptrend.
Red solid line – current downtrend.
Red dotted line – projected continuation of the downtrend.
The solid lines represent existing market trends, while the dotted lines forecast possible future movements. This visual setup gives traders a better overview of price behavior and potential turning points.
When the market changes direction or new extremes appear, the indicator automatically adjusts the trend lines’ angle or removes outdated ones. This keeps your chart accurate and relevant without manual redrawing.
Why Trend Lines Matter in Forex
Trend lines are essential because they reflect the collective sentiment of market participants. When prices consistently react to a line — either bouncing off or breaking through — that line becomes a critical support or resistance zone.
However, manual trend lines often cause confusion due to:
Subjective placement by different traders.
Frequent redrawing after market shifts.
Misinterpretation of false breakouts.
The Auto TrendLine Indicator solves these issues by calculating trend lines objectively and adjusting them only during genuine breakouts or reversals.
This makes it especially helpful during high-volatility periods, such as news events, where prices can spike erratically. The indicator smooths out this noise, making trend interpretation far easier.
How to Trade Using the Auto TrendLine MT4 Indicator
Trading with the Trend
As a general rule, trading in the direction of the prevailing trend is considered the safest approach.
Buy (Long): When price respects or bounces off the blue uptrend line.
Sell (Short): When price touches or reacts to the red downtrend line.
Always place your Stop Loss beyond the trend line to protect against sudden breakouts and use Take Profit levels based on previous highs/lows or major zones.
Combining with Other Tools
For higher accuracy, combine the Auto TrendLine with:
Auto Support & Resistance Indicator – to confirm entry zones.
Trendline Price Alert Indicator – to receive alerts on line breakouts.
Price Action or Candle Patterns – for confirmation of reversals.
This combination helps traders filter false signals and identify true market momentum.
Trading Breakouts and Reversals
When the price breaks through a trend line, it can signal a potential Trend Reversal.
If a downtrend line is broken upward, look for long entries.
If an uptrend line is broken downward, look for short opportunities.
Set a Stop Loss just beyond the broken trend line and aim for a risk-to-reward ratio of 1:3 for optimal trade management.
Pros and Cons of the Auto TrendLine Indicator
Pros
Automatically plots the most relevant trend lines.
Saves time and eliminates subjective errors.
Non-repainting – adjusts only during real trend changes.
Keeps charts clean and easy to analyze.
Suitable for all skill levels and market assets (Forex, indices, crypto).
Cons
May not display very short-term trend lines.
Works best when combined with confirmation tools.
Unexpected news events may still trigger false breakouts.
Frequently Asked Questions (FAQ)
Q: Does the Auto TrendLine Indicator repaint?
No. It updates lines only when genuine market breakouts or new highs/lows occur, without altering past data.
Q: What timeframes work best?
It functions on all timeframes, but H1 and H4 are ideal for accuracy and signal clarity.
Q: Can I use it alone?
Yes, though combining it with support/resistance or volume-based indicators provides stronger confirmation.
Q: Is it beginner-friendly?
Absolutely. It simplifies chart analysis and helps new traders focus on trading decisions rather than drawing lines manually.
Q: Can I use it beyond Forex?
Yes, it works effectively on commodities, indices, and cryptocurrencies available in MT4.
Conclusion
The Auto TrendLine MT4 Indicator is a powerful, time-saving tool for anyone who relies on trend-based strategies. By automatically identifying valid trend lines and adjusting dynamically to price action, it provides an accurate view of market direction while keeping your chart clean.
It’s an essential companion for traders who want to focus on decision-making instead of manual charting. To download this indicator and explore more Forex trading tools, visit IndicatorForest.com today.
Also, check out our related post: Best 7 Trend Indicators for MT4 and MT5 for building a complete trend-following system.
FAQ
24 Downloads
Published:
Nov 11, 2025 02:24 AM
Category: