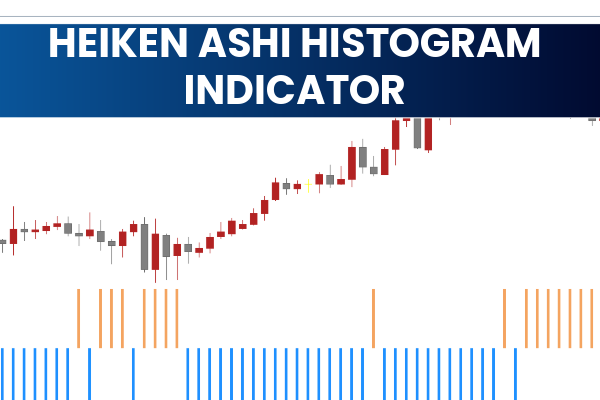
The Heiken Ashi Histogram Indicator for MetaTrader 5 (MT5) is a refined version of the traditional Heiken Ashi oscillator. It transforms complex market data into simple, color-coded histograms that help traders instantly recognize the trend direction, momentum, and potential reversals.
In Japanese, Heiken Ashi means “average bar,” and this indicator stays true to its roots by smoothing Price Action and eliminating market noise. The result is a clean, easy-to-read display that improves trading accuracy, whether you are a scalper, intraday trader, or swing trader.
How the Heiken Ashi Histogram Indicator Works
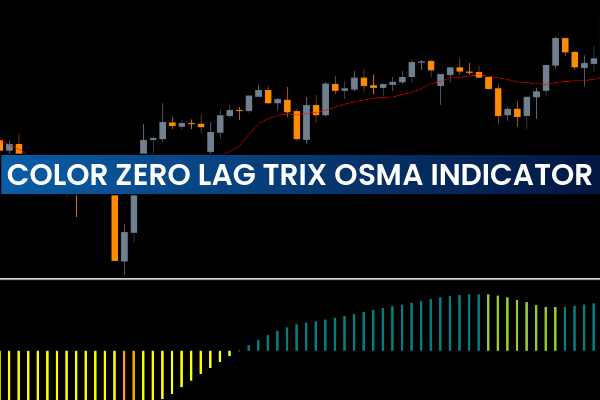
The Heiken Ashi Histogram Indicator MT5 calculates and displays the difference between Heiken Ashi values and the standard price, presenting it as a histogram with two main colors:
Light Blue Bars: Represent bullish momentum or uptrend.
Orange Bars: Represent bearish momentum or downtrend.
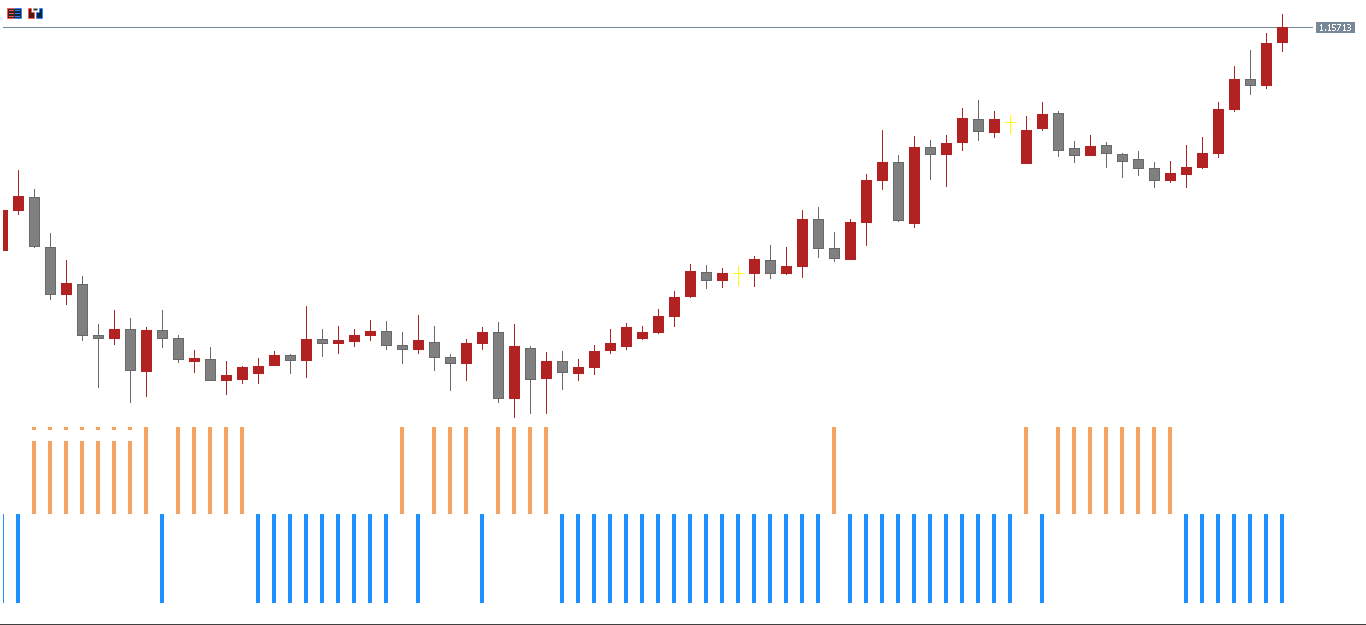
When several consecutive bars of the same color appear, it indicates a strong and consistent trend. In contrast, alternating colors may suggest market indecision or a possible reversal.
This visual simplicity makes it easy to analyze markets without relying on cluttered candlestick charts.
Advantages of Using the Heiken Ashi Histogram Indicator
Simplified Trend Analysis
The color-coded histogram gives a clear visual cue of the current market sentiment—blue for bullish, orange for bearish—allowing quick decision-making.
Reliable Trend Strength Detection
Long streaks of same-colored bars signal strong momentum and increase confidence in trend continuation.
Applicable to All Timeframes and Pairs
The indicator performs well across different markets—forex, commodities, indices, and cryptocurrencies—and on any timeframe, from 1-minute charts to daily.
Multi-Style Compatibility
The indicator suits all trading styles, whether Scalping, intraday, or swing trading, helping traders identify high-probability setups.
Filters Market Noise
By smoothing out volatility, it eliminates false price fluctuations, focusing only on meaningful market trends.
How to Trade Using the Heiken Ashi Histogram Indicator
Before trading, familiarize yourself with the color logic of the histogram:
Light Blue Bars: Signal an uptrend or bullish strength.
Orange Bars: Signal a downtrend or bearish momentum.
However, a blue bar does not guarantee that prices will immediately rise, nor do red/orange bars promise a sudden drop. Always wait for price confirmation before entering trades.
Example: GBP/USD Chart
In the example of the GBP/USD H4 chart, long sequences of blue bars indicated the start of a strong bullish trend, leading to a rise of over 100 pips.
Conversely, when orange bars appeared consecutively, the indicator signaled a bearish reversal, and the price fell by about 100 pips.
This demonstrates how the indicator captures the transition between bullish and bearish market phases clearly and effectively.
Trading Tips for the Heiken Ashi Histogram
Combine with Moving Averages or trendline analysis for better entry confirmation.
Avoid trading during choppy or low-volume sessions.
Use multiple timeframes to align short-term and long-term trends.
For scalping, focus on shorter periods; for swing trades, use higher timeframes.
Conclusion
The Heiken Ashi Histogram Indicator for MT5 is a powerful and visually intuitive tool that simplifies trend analysis. By converting Heiken Ashi data into easy-to-read histograms, traders can quickly identify trend direction, momentum strength, and potential reversals without cluttering their charts.
Whether you are a beginner or an advanced trader, this free MT5 indicator provides clear, reliable, and visually appealing trading insights to improve your overall strategy and performance.
FAQ
3 Downloads
Published:
Nov 07, 2025 09:46 AM
Category: