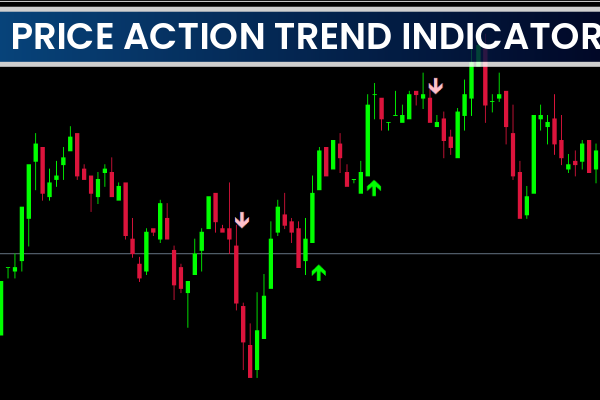
The Price Action Trend Indicator is a simple yet powerful MetaTrader 4 (MT4) tool that helps traders identify trend direction using visual arrows. It displays two types of arrows — an up (lime) arrow for bullish trends and a down (pink) arrow for bearish movements.
This indicator is ideal for both beginners and experienced traders because it eliminates the guesswork of analyzing trend direction. Whether you trade Forex, indices, or commodities, the Price Action Trend Indicator can help you make faster and more accurate trading decisions.
How the Price Action Trend Indicator Works
At its core, the Price Action Trend Indicator for MT4 uses market momentum and price behavior to plot arrows on the chart. When the indicator detects upward momentum, a lime arrow appears, signaling a potential buy opportunity. Conversely, when momentum weakens or reverses, a pink arrow appears, suggesting a sell opportunity.
These arrows can serve as a visual confirmation for traders who use price action strategies, helping them spot market reversals, trend continuations, or pullbacks.
However, traders should be aware that the indicator can repaint—that means the signal may disappear if the candlestick formation changes. For best results, wait until the candle closes before making an entry.
How to Use the Price Action Trend Indicator
Attach the Indicator
Once installed on your MT4 platform, attach the indicator to your preferred chart.
Watch for Arrows
Lime Arrow (Buy Signal): Suggests a bullish trend or potential upward move.
Pink Arrow (Sell Signal): Indicates a bearish trend or possible downward move.
Confirm with Higher Timeframes
To avoid false signals—especially on smaller timeframes—it’s best to identify the overall trend on higher timeframes like H4 or D1.
Use with Other Indicators
For improved accuracy, combine the Price Action Trend Indicator with popular confirmation tools such as the MACD, RSI, or moving averages. This multi-indicator approach strengthens your trade confidence.
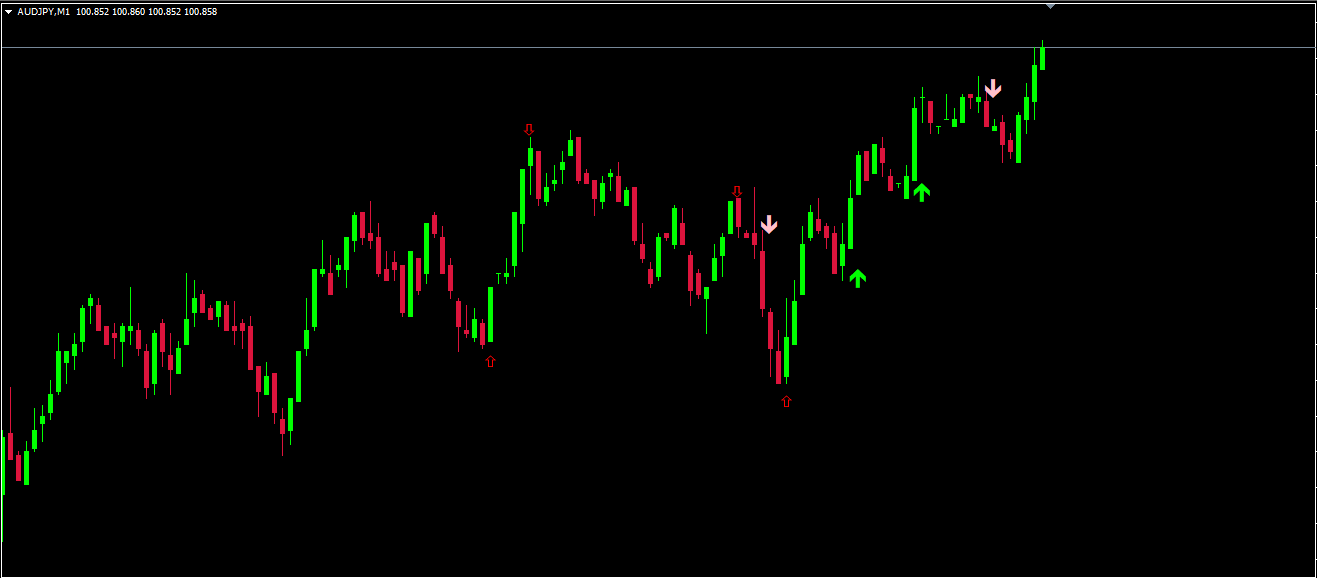
Example of Trading Setup
The GBP/USD H4 chart provides a clear example of how this indicator works in practice.
When a lime arrow appears, you can take a long trade after confirming upward momentum. On the other hand, a pink arrow signals a short trade opportunity once bearish movement is confirmed.
In ongoing trends, the indicator may plot multiple arrows within the same direction. These can either confirm a Trend Continuation or hint at a reversal.
Tips for Best Results
Always wait for candle closure before entering a trade to avoid false entries caused by repainting signals.
Combine the indicator with trend confirmation tools like MACD or RSI.
Manage your risk with proper stop-loss and take-profit levels.
Test the indicator on a demo account before using it live.
Conclusion
The Price Action Trend Indicator for MT4 simplifies trend analysis by plotting easy-to-read arrows for trade entries and exits. It helps traders quickly spot buying and selling opportunities across all timeframes. While repainting may occur, combining it with other indicators enhances its reliability.
You can download the Price Action Trend Indicator for free and explore many more powerful MT4 and MT5 tools at IndicatorForest.com — your go-to source for the best trading indicators and strategies.
3 Downloads
Last Update:
Nov 03, 2025 15:16 PM
Published:
Nov 03, 2025 14:45 PM
Category: