Master Market Geometry with the Parallel Pivot Lines Indicator for MT5
Technical analysis is often a search for symmetry in a chaotic market. For traders using MetaTrader 5, the Parallel Pivot Lines Indicator is a sophisticated tool that moves beyond basic horizontal Support And Resistance. It focuses on the market's geometric flow, helping traders identify the precise sloped corridors where price action lives and breathes.
What is the Parallel Pivot Lines Indicator?
The Parallel Pivot Lines Indicator is an advanced charting tool that automatically identifies significant price pivots and projects parallel trendlines across the chart. Unlike standard pivot points that reset daily or weekly on a horizontal axis, this indicator adapts to the market's current angle of ascent or descent.
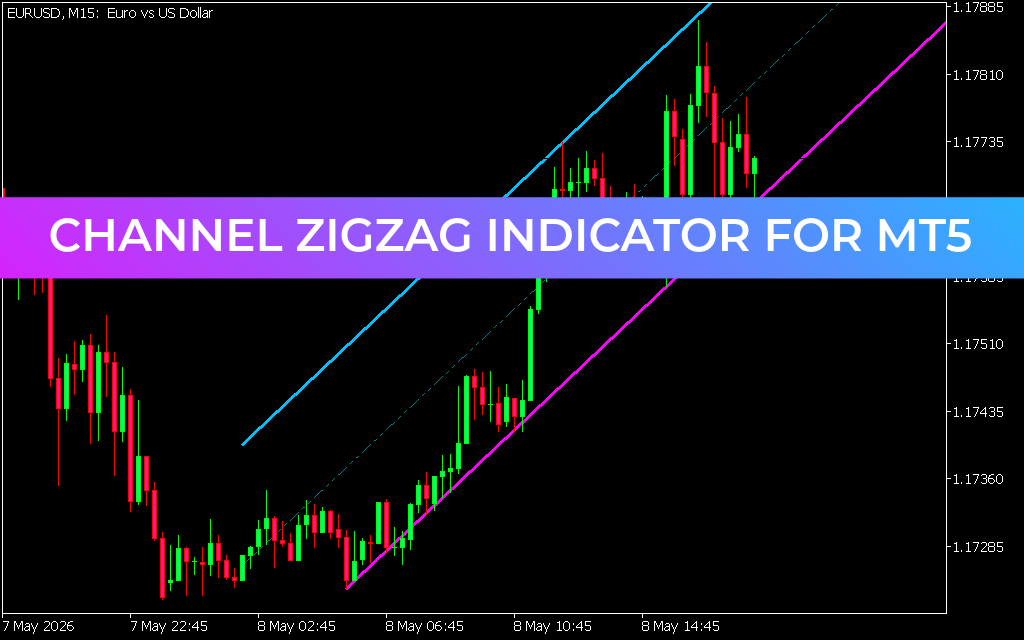
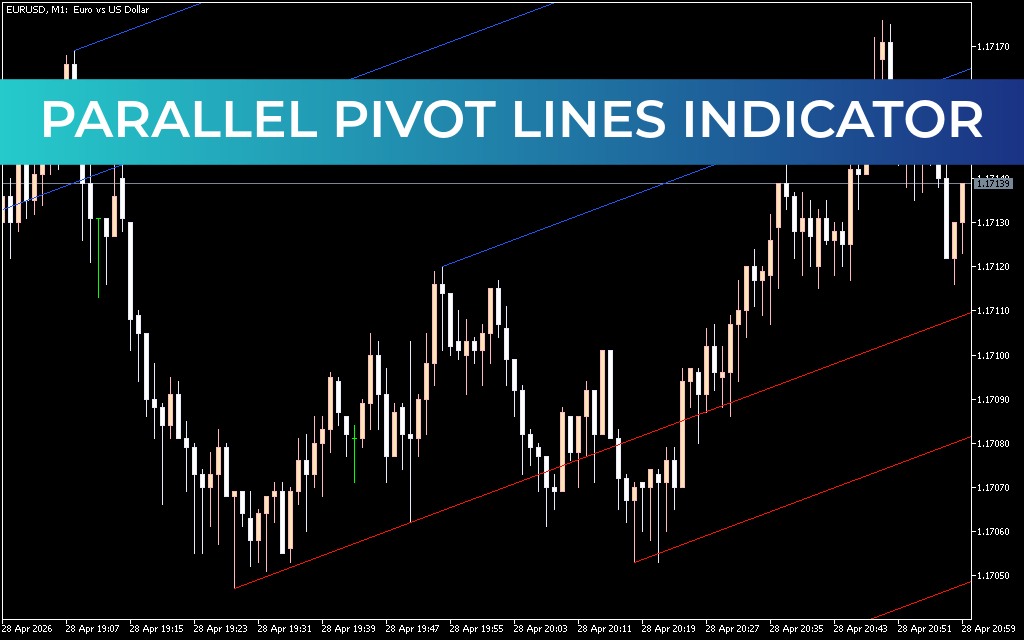
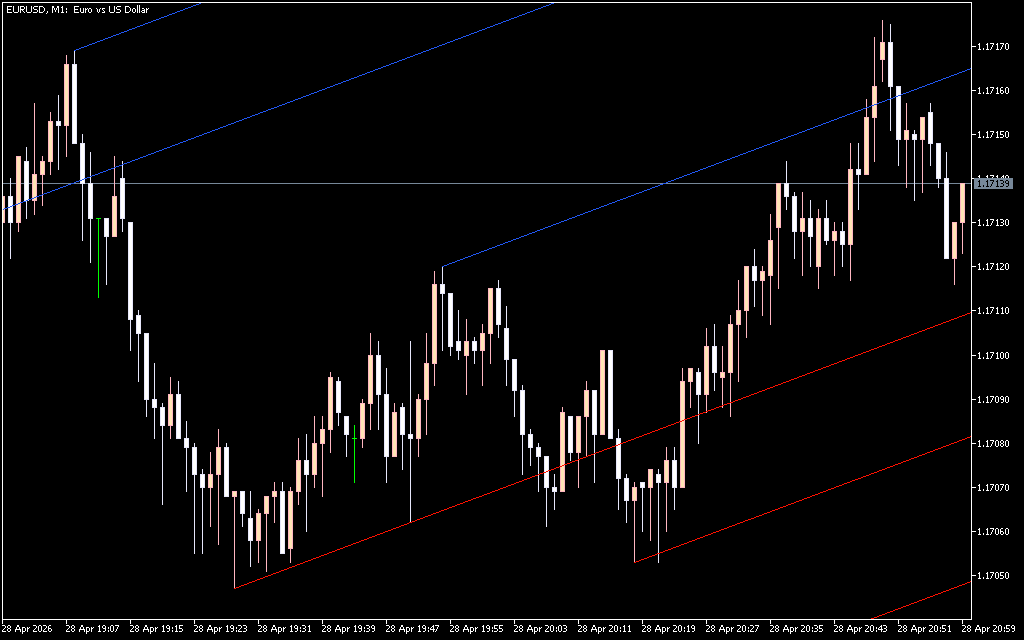
As seen in the EUR/USD M1 chart, the indicator draws a series of ascending or descending parallel channels. These lines—often color-coded (such as blue for resistance zones and red for support zones)—create a visual roadmap. When the price interacts with these lines, it signals that the market is respecting a specific mathematical slope, offering high-probability entry and exit zones.
Key Features of Parallel Pivot Lines
- Dynamic Channel Mapping: Automatically connects swing highs and swing lows to create equidistant channels, revealing the true "speed" of the market.
- Predictive Support and Resistance: By projecting lines into the future, the indicator allows traders to anticipate where price might stall or reverse before it even gets there.
- Visual Clarity on M1 Timeframes: Specifically effective for scalpers, it helps define the boundaries of short-term volatility, making it easier to spot breakouts and mean-reversion trades.
- Multi-Level Projection: It doesn't just provide one channel; it often projects multiple parallel levels, acting as a "ladder" for price targets during strong trending moves.
Trading Strategy: Leveraging Geometric Flow
To trade effectively with the Parallel Pivot Lines Indicator, focus on the "Three R's": Rejection, Retest, and Ride.
- Rejection at Extreme Boundaries: The outer lines of the parallel set represent the "overbought" and "oversold" boundaries of the current trend. A bearish candlestick pattern at the top blue line (resistance) is a prime signal for a short scalp.
- The Midline Retest: The center lines often act as magnets. When price breaks a midline and then returns to "test" it, this frequently offers a safe entry point to join the prevailing trend.
- Riding the Corridor: As long as the price stays within the red support and blue resistance corridors, traders can confidently hold positions, using the parallel lines as trailing stop-loss markers.
Why MT5 Traders Choose Parallel Pivots
In a market dominated by algorithms, price rarely moves in straight horizontal lines. The Parallel Pivot Lines Indicator gives retail traders an institutional-grade view of Market Structure. By identifying the geometric equilibrium of pairs like EUR/USD, it allows you to trade with the flow of the market rather than against it.
8 Downloads
Last Update:
Apr 28, 2026 23:03 PM
Published:
Oct 24, 2025 22:22 PM
Category: