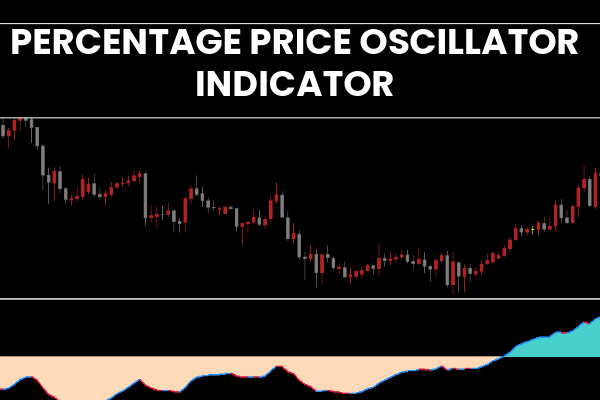
The Percentage Price Oscillator (PPO) Indicator for MetaTrader 5 (MT5) is a momentum-based technical analysis tool that helps traders identify the strength and direction of a trend. Similar to the MACD, the PPO measures the difference between two Exponential Moving Averages (EMAs) as a percentage of the longer EMA.
This indicator gives a clear visual representation of bullish and bearish momentum using color-coded histograms and EMA lines. It is ideal for trend-following traders who prefer to trade in the direction of the prevailing momentum.
How the Percentage Price Oscillator Works
The PPO Indicator plots two EMAs — a fast EMA and a slow EMA — and calculates their percentage difference. The result is displayed as an oscillator that moves above and below the zero level:
Blue Line: Indicates bullish momentum and upward price movement.
Red Line: Indicates bearish momentum and downward pressure.
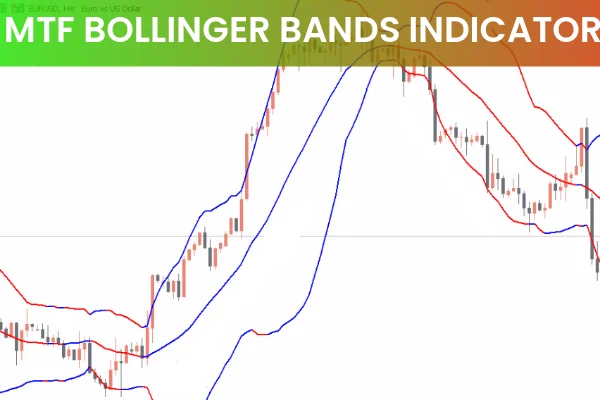
Colored Area Between Line and Zero Level: Visually shows the current market trend — blue-green for bullish conditions and light orange for bearish moves.
Additionally, the PPO includes a signal line EMA, which acts as a trigger for potential entry and exit points. Like other oscillators, the PPO fluctuates between positive and negative zones, typically within a +0 to –0 range.
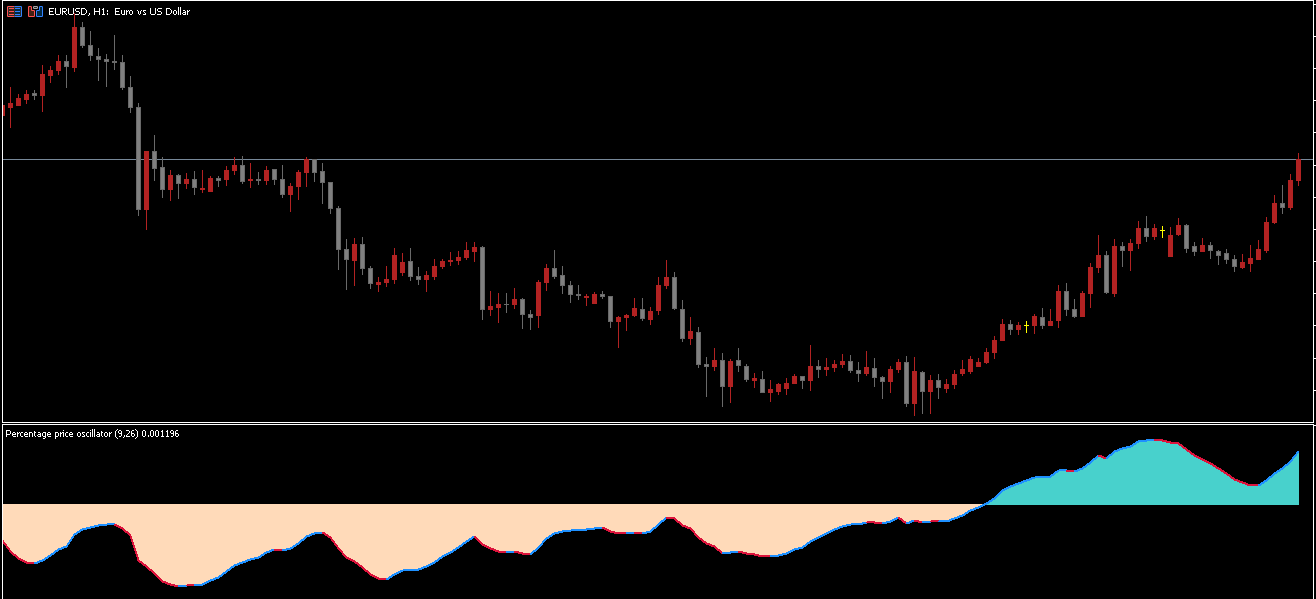
Percentage Price Oscillator BUY/SELL Signals
The GBP/USD H1 chart above demonstrates how traders can identify PPO trading signals:
BUY Signal:
When the PPO area turns blue-green and the PPO line (blue) rises above the zero line, it indicates a bullish crossover. This means the fast EMA has crossed above the slow EMA, suggesting the start of an uptrend.
Traders can open buy positions and hold them as long as the indicator stays above zero.
SELL Signal:
When the PPO area turns light orange and the line turns red while moving below zero, it signals a bearish crossover. The fast EMA moves below the slow EMA, confirming downward momentum.
Traders can open short positions and ride the downtrend until the indicator returns toward zero.
The distance between the PPO line and zero represents the strength of the trend — the greater the distance, the stronger the momentum.
At the moment when the indicator crosses the zero line, traders may consider closing their open positions or preparing for a potential reversal.
How to Trade Effectively with the PPO Indicator
Use Longer Timeframes:
Although the PPO works on any chart, higher timeframes such as H4 or D1 provide more reliable trend signals and reduce false entries.
Combine with Price Action:
Use PPO signals with Support And Resistance or Candlestick Patterns for higher accuracy.
Confirm with a Signal Line Crossover:
Enter trades when the PPO line crosses above or below the signal line to align entries with real market momentum.
Avoid Overtrading:
Stay out of sideways or low-volatility markets, as PPO signals can lag during consolidation phases.
Advantages of the Percentage Price Oscillator
Provides clear visual cues for bullish and bearish momentum.
Measures Trend Strength using EMAs.
Works across multiple timeframes and asset classes.
Helps traders spot early reversals and exit points.
Fully customizable and free to download for MT5.
Conclusion
The Percentage Price Oscillator (PPO) Indicator for MT5 is a reliable momentum tool that helps traders detect trend direction, strength, and reversal points with ease. By analyzing the crossover of two EMAs and observing the zero-line movement, traders can make more informed entry and exit decisions.
Whether you’re a beginner or an experienced trader, the PPO indicator offers an effective way to analyze market momentum and refine your trading strategy.
FAQ
5 Downloads
Published:
Nov 07, 2025 09:56 AM
Category: