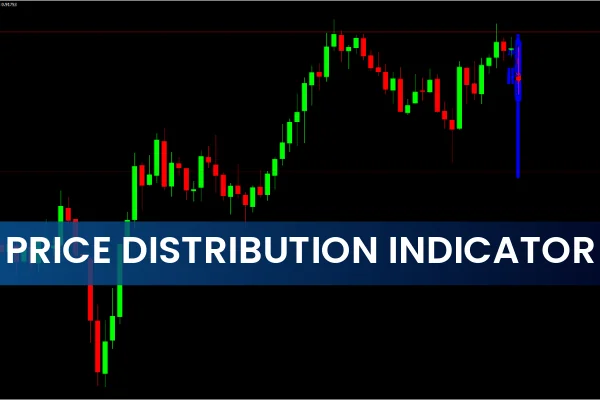
The Price Distribution Indicator for MT4 is a specialized forex tool that helps traders analyze price behavior within higher timeframe candles—particularly the H4 candle—on lower timeframe charts. By doing so, traders can gain a deeper understanding of how bulls and bears interact within a given period.
This indicator is highly effective for identifying Support And Resistance zones, consolidation areas, and potential breakout points. Both new and experienced traders can benefit from its visual clarity, as it offers insights into the internal structure of Price Action that standard candlestick charts often miss.
By showing price distribution and watermark levels, this indicator allows traders to see not just where price has been, but how it moved within that period, providing a clearer view of market sentiment.
How the Price Distribution Indicator Works
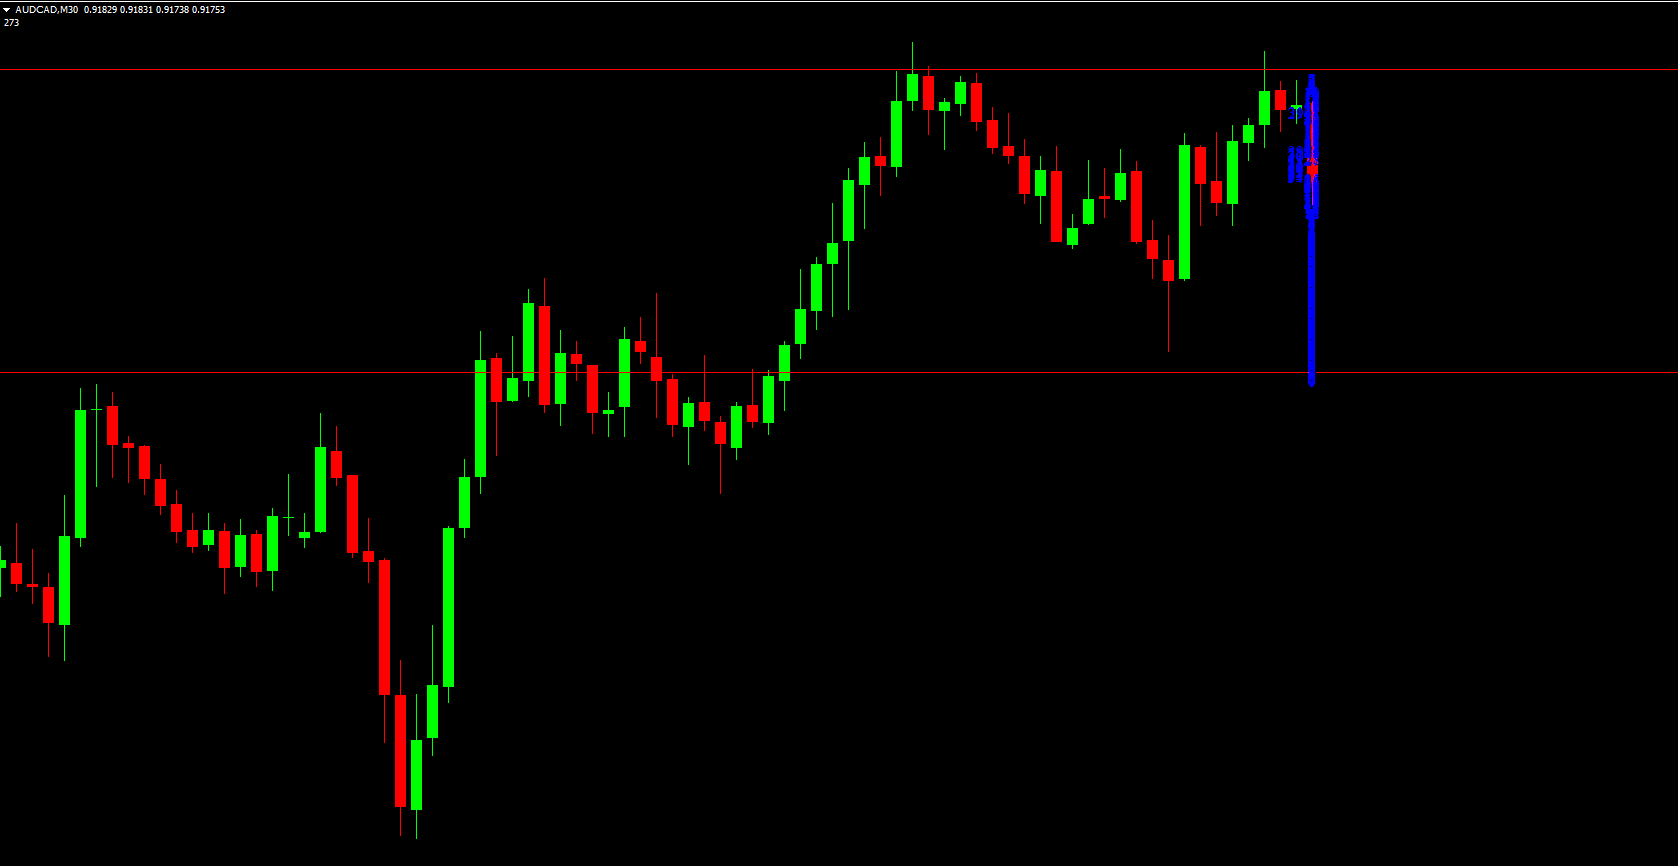
The Price Distribution Indicator works by plotting the price distribution of an H4 candle directly on a lower timeframe chart (such as M5, M15, or M30).
The price values are plotted in blue, displaying how the price fluctuated within the H4 candle.
High watermark and low watermark levels are drawn in red, marking the upper and lower boundaries of that candle’s range.
These plotted levels allow traders to:
Identify key support and resistance zones.
Detect areas of price accumulation (where the market is consolidating).
Spot breakouts or rejections at the high and low watermarks for precise trade entries.
Tip: Always set the indicator’s timeframe input higher than the chart you are using. For instance, if the chart is M15, input H4 to visualize that candle’s internal price distribution.
How to Trade Using the Price Distribution Indicator
Identify Consolidation Zones
When you notice multiple price values clustered around a specific area (indicating prolonged consolidation), this represents a strong support or resistance level.
If the price repeatedly tests the upper watermark without breaking it, sellers dominate that area.
If it repeatedly tests the lower watermark without breaking it, buyers are in control.
Look for Breakout Opportunities
Breakouts from either the high watermark or low watermark lines signal potential trend continuations or reversals.
Buy setup: Wait for a break above the high watermark, then confirm with price closing above it.
Sell setup: Wait for a break below the low watermark, then confirm with price closing below.
Analyze Price Accumulation
When price values stay within a tight range for a long time, it indicates market accumulation. This often precedes a strong directional movement once the range breaks.
Using this indicator, traders can prepare in advance for volatility expansions, making it especially useful for breakout and swing trading strategies.
Benefits of the Price Distribution Indicator for MT4
Visual Price Insight: Offers a clear look at how price moved within a higher timeframe candle.
Accurate Support/Resistance Identification: Helps pinpoint strong zones for entries and exits.
Detects Market Sentiment: Shows which side—bulls or bears—is dominant in a given period.
Enhances Multi-Timeframe Analysis: Ideal for traders who analyze structure across different chart levels.
Simple Yet Powerful: No complex parameters; just select the desired higher timeframe and let the tool do the work.
Example Trade Setup
On the EUR/USD M15 chart, the Price Distribution Indicator displays the H4 candle distribution.
Price repeatedly touches the high watermark (red line) but fails to break through.
After forming a bearish engulfing candle, the trader enters a sell position, confirming a rejection from resistance.
The target is set near the low watermark, with a stop loss just above the resistance zone.
This simple setup illustrates how traders can leverage price distribution and watermark levels to make well-timed trades.
Conclusion
The Price Distribution Indicator for MT4 is an excellent analytical tool for understanding price dynamics, market consolidation, and breakout levels within higher timeframe candles. It empowers traders to visualize price action more comprehensively, leading to more confident and data-driven decisions.
Whether you’re a scalper, day trader, or swing trader, this indicator gives you a unique perspective on Market Structure that’s often hidden on regular charts.
Download the Price Distribution Indicator for MT4 now at IndicatorForest.com and start mastering price movement with precision.
Published:
Nov 06, 2025 01:08 AM
Category: