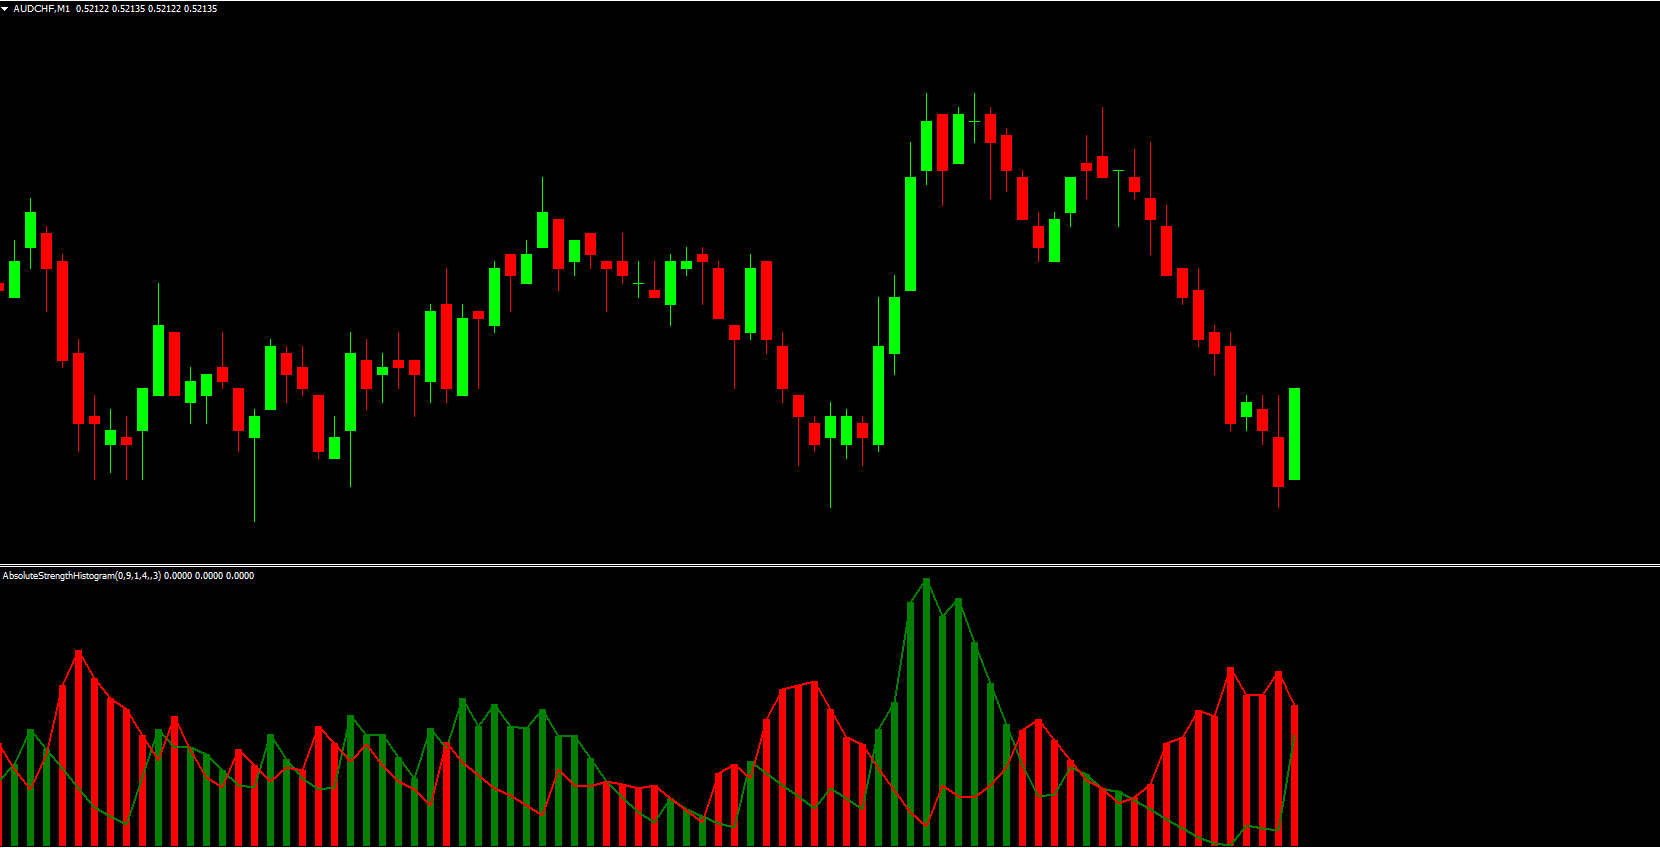
The Absolute Strength Histogram Indicator for MetaTrader 4 is a versatile tool designed to measure Trend Strength and generate BUY and SELL trading signals for forex traders. By combining histogram color changes with bullish and bearish signal line crossovers, the indicator provides clear entry and exit points while helping traders gauge market momentum.
Suitable for both new and advanced traders, this indicator is simple to use yet provides detailed technical insights. Beginners can quickly identify bullish and bearish trends, while experienced traders can combine trend strength values with trend lines, channels, and support/resistance levels for a comprehensive trading strategy.
How the Absolute Strength Histogram Works
The indicator is displayed in a separate MT4 window and consists of:
Histogram bars: Indicate the strength of the trend
Bullish signal line (GREEN): Shows upward momentum
Bearish signal line (RED): Shows downward momentum
The height of the histogram bars represents the intensity of buyers or sellers. Taller bars suggest strong momentum, while shorter bars indicate a weakening trend. Traders can use this information to hold, exit, or adjust trades accordingly.
Trading Signals Using the Indicator
The Absolute Strength Histogram uses two parameters to generate entry signals:
Histogram color: Changes to GREEN for bullish trends and RED for bearish trends
Signal line crossover: GREEN bullish line crossing above RED bearish line indicates a buy opportunity, while the RED bearish line crossing above GREEN bullish line signals a sell opportunity
BUY Signal Example
Histogram turns GREEN
GREEN bullish line crosses above RED bearish line
Enter a BUY position with stop loss below the previous swing low
Continue to hold the trade as long as the histogram stays GREEN and the bullish line remains above the bearish line
SELL Signal Example
Histogram turns RED
RED bearish line crosses above GREEN bullish line
Enter a SELL position with stop loss above the previous swing high
Maintain the trade until the histogram changes to GREEN or the signal lines reverse
This method allows trend-following traders to capture the majority of market moves while exiting positions with confidence when momentum slows.
Using Trend Strength for Trade Management
One of the key benefits of the Absolute Strength Histogram Indicator is its ability to measure the strength of the trend. Changes in histogram bar height reveal whether the trend is gaining or losing momentum. Traders can use this information to:
Decide whether to hold or exit positions
Confirm Trend Continuation or weakening
Combine with Price Action analysis for enhanced entry/exit precision
By tracking both signal line crossovers and trend strength, traders gain a complete picture of market conditions.
Best Practices and Timeframes
The indicator works well on all timeframes:
Intraday charts: For short-term trades
Daily, weekly, and monthly charts: For medium and long-term trend analysis
Because it provides both entry/exit signals and trend strength, it can be used effectively for Scalping, intraday trading, or longer-term positions.
Conclusion
The Absolute Strength Histogram Indicator for MT4 is a powerful and user-friendly tool for forex traders. It provides clear buy and sell signals, measures trend strength, and helps traders manage positions effectively. With its easy installation and free availability, it is an essential indicator for both beginner and advanced traders looking to enhance their trading strategy.
For more MT4 indicators and professional trading tools, visit IndicatorForest.com and explore our extensive collection.
FAQ
Published:
Nov 22, 2025 09:58 AM
Category: