Bollinger Bands vs. Envelopes: Choosing the Right Volatility Channel for MT4
In the realm of technical analysis, channel-based indicators are essential for defining market boundaries, identifying overbought or oversold conditions, and spotting potential reversals. Among the most popular are Bollinger Bands and Envelopes. While they appear similar at a glance, their mathematical foundations and practical applications on MetaTrader 4 (MT4) differ significantly. Understanding these nuances is key to selecting the right tool for your specific trading style.
The Dynamic Flexibility of Bollinger Bands
Bollinger Bands consist of a central moving average flanked by two outer bands. The core differentiator is that these outer bands are calculated based on standard deviation. This means the bands are "elastic"—they expand during periods of high market volatility and contract (the "squeeze") when the market is quiet.
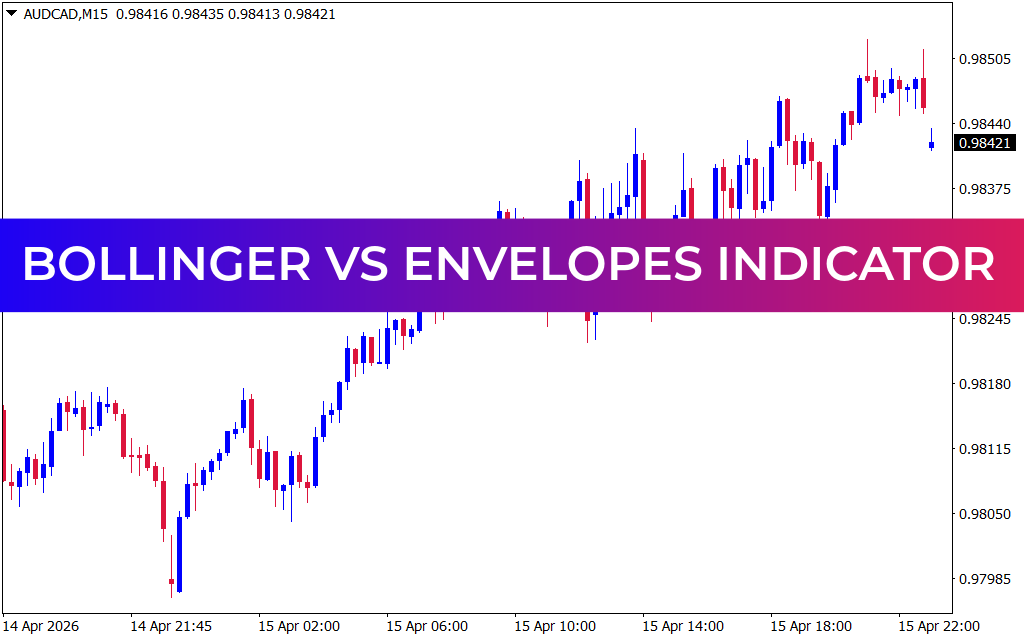
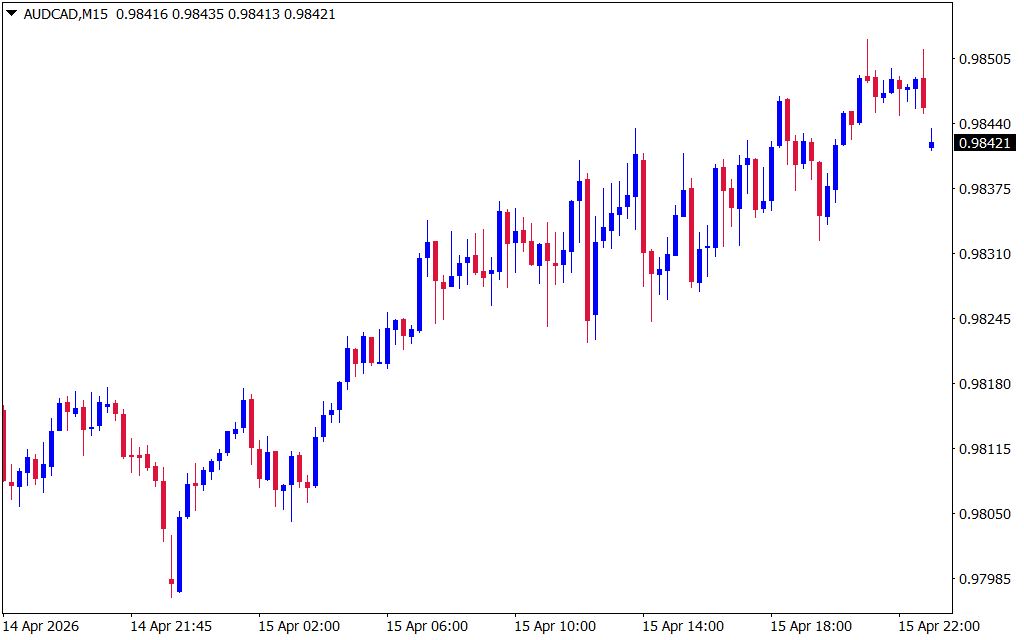
As seen in recent AUD/CAD M15 chart analysis, Bollinger Bands provide a high-impact visual of market "breathing":
- The Squeeze: When the bands tighten, it signals low volatility, often preceding a massive breakout move.
- Walking the Bands: In a strong trend, price often "hugs" the upper or lower band. This is a sign of high momentum, rather than an immediate signal to fade the move.
- Mean Reversion: Because 95% of Price Action typically stays within two standard deviations, a touch of the outer bands followed by a reversal candle is a classic "overextended" signal.
The Structural Rigidity of Envelopes
Envelopes also utilize a central moving average, but their outer boundaries are calculated using a fixed percentage deviation. Unlike Bollinger Bands, Envelopes do not expand or contract based on volatility; they maintain a constant width relative to the central average.
This structural rigidity offers a different tactical advantage:
- Filtering Noise: Because the bands don't move with every minor price spike, Envelopes are excellent for identifying the "true" extremes of a trading range.
- Trend Following: Envelopes are often used to define a "trend channel." If price stays consistently above the upper envelope, it confirms a strong bullish regime without the distraction of bands widening.
- Consistency: For traders who prefer fixed targets, Envelopes provide a more stable reference point for taking profits at specific percentage extremes.
Which Indicator Should You Choose?
The choice between Bollinger Bands and Envelopes depends largely on your timeframe and strategy:
- For Scalpers (M1 to M15): Bollinger Bands are generally superior. Intraday volatility shifts rapidly, and having bands that adapt to the London or New York open is crucial for managing risk.
- For Range Traders: Envelopes excel here. By setting a fixed percentage that historically contains price, you can identify "true" deviations from the mean that aren't skewed by temporary volatility spikes.
- For Breakout Traders: Bollinger Bands are the clear winner. The "Squeeze" is a legendary precursor to high-momentum breakouts that Envelopes simply cannot detect.
Conclusion
Both Bollinger Bands and Envelopes are powerful tools for mapping market extremes on MT4. While Bollinger Bands offer a dynamic, volatility-adjusted view of the market, Envelopes provide a stable, structural framework for trend and range analysis. Many professional traders combine both—using Envelopes for the macro trend and Bollinger Bands for precision timing and volatility awareness.
11 Downloads
Last Update:
Apr 16, 2026 02:22 AM
Published:
Feb 10, 2026 21:30 PM
Category: