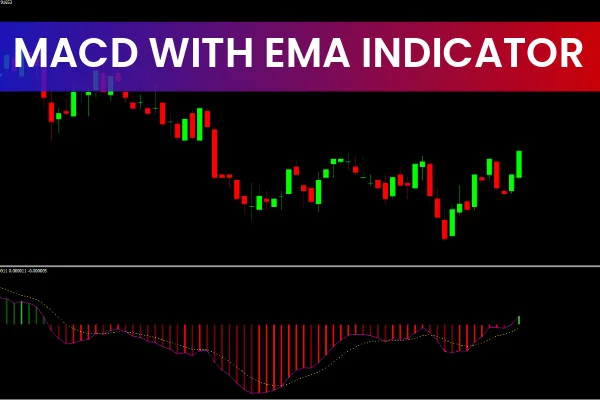
The MACD with EMA Indicator is a powerful forex trading tool that combines the Moving Average Convergence Divergence and Exponential Moving Averages to highlight trend direction and momentum shifts. Traders rely on this upgraded version of the classic MACD because it provides clearer BUY and SELL signals using fast and slow EMAs, a signal line, and a momentum-based histogram.
How the MACD with EMA Works
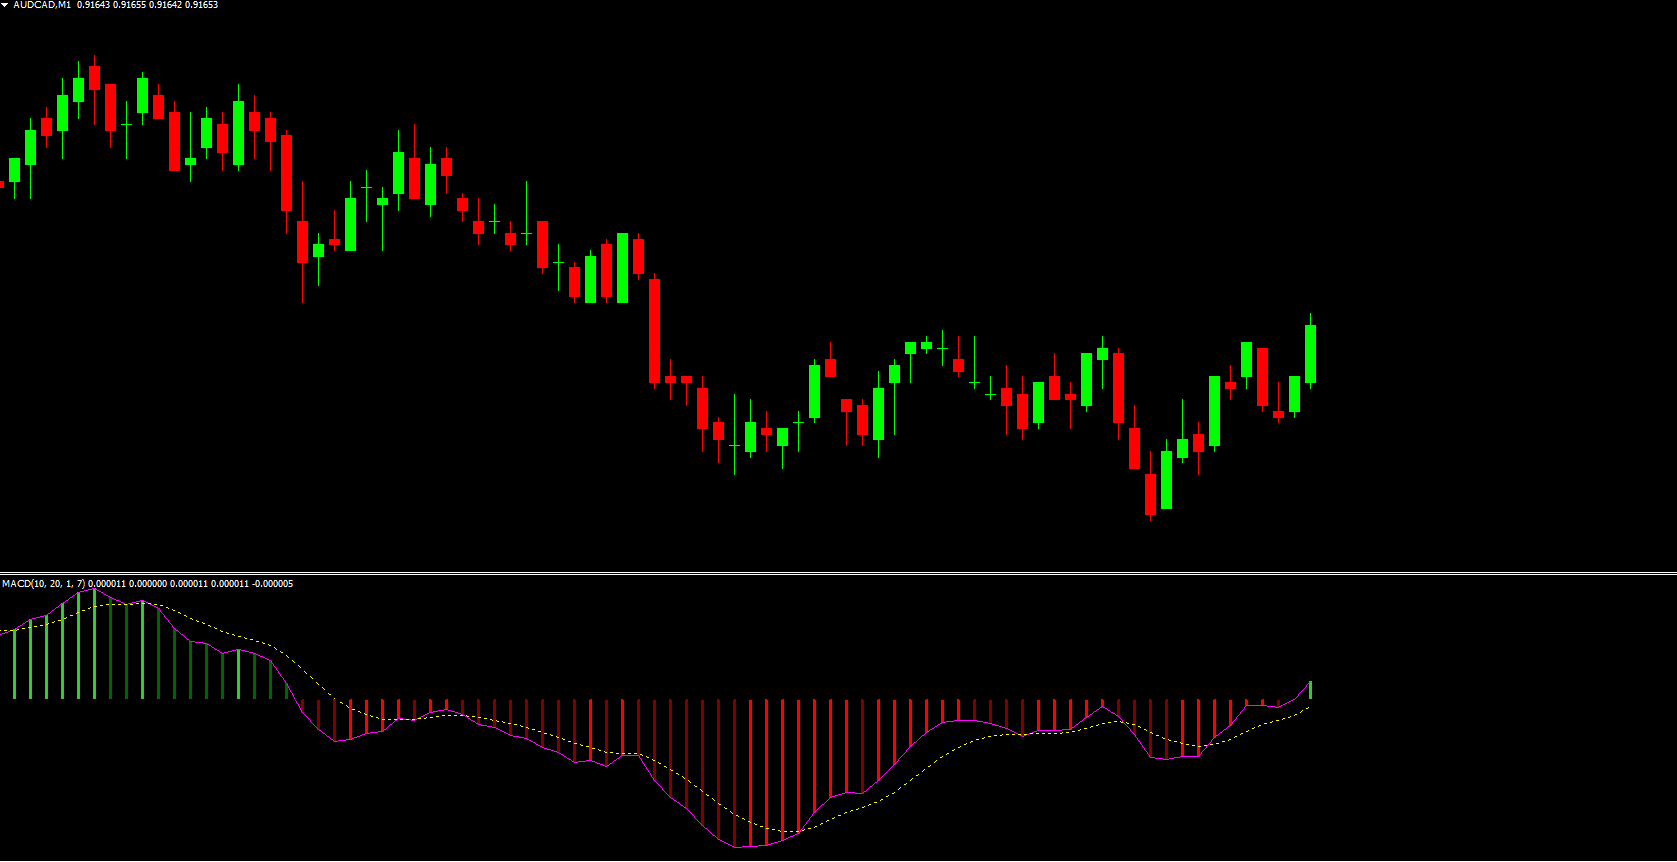
The indicator uses two EMAs—one fast and one slow—to calculate the MACD line. By subtracting the two EMAs, it generates a signal line that shows the strength and direction of the trend. Together with the colored histogram, it provides insight into market momentum, Trend Continuation, and possible reversals.
The Signal Line
The MACD signal line—derived from EMA calculations—offers actionable trading alerts.
When bars go above the signal line → potential BUY signal
When bars go below the signal line → potential SELL signal
These alerts help traders better time their entries and exits.
Understanding the Histogram
The histogram is one of the most valuable aspects of the MACD with EMA Indicator. It visually represents divergence and market shifts:
Green bars → bullish momentum building
Red bars → bearish momentum strengthening
This makes it easier to spot when a trend will continue or reverse. For example, a series of green bars may signal an upcoming top, prompting traders to exit long positions and prepare for shorts.
Best Timeframes for MACD with EMA
While the indicator works on any timeframe, it performs more reliably on longer ones such as:
4-hour
Daily
Weekly
Larger timeframes reduce noise and produce fewer false signals, making trend identification more accurate.
BUY and SELL Signal Examples
On a GBP/USD daily chart, you might observe:
A BUY signal when the histogram turns from red to green, and the bars rise above the signal line.
A SELL signal when green bars fade into red, showing momentum loss and an upcoming Trend Reversal.
The histogram in this indicator acts as both a continuation and reversal guide, helping traders react quickly to Market Structure changes.
MACD vs. EMA: Key Differences
Many traders wonder whether MACD uses EMA or SMA, and whether the two indicators are similar.
Does MACD use EMA or SMA?
The MACD with EMA Indicator uses EMA exclusively—both for the fast/slow MA inputs and for the signal line.
Are EMA and MACD the same?
No. The EMA is a single moving average line, while the MACD combines EMAs, a histogram, and a signal line for deeper market analysis.
Why Traders Should Use the MACD with EMA Indicator
This indicator offers multiple advantages:
Accurate trend identification
Early detection of momentum shifts
Clear visual signals
Reduced noise on higher timeframes
Free access and beginner-friendly usability
The combination of EMA dynamics with MACD analysis makes it a must-have tool for traders aiming to improve their strategy.
Conclusion
The MACD with EMA Indicator is an essential tool for forex traders who want to identify trends, reversals, and momentum changes with precision. By combining fast/slow EMAs, a signal line, and a color-coded histogram, it enhances decision-making and minimizes guesswork.
For more trading indicators and powerful tools, visit IndicatorForest.com and explore our free downloads.
FAQ
1 Download
Published:
Nov 15, 2025 00:23 AM
Category: