The MTF MACD Bars Indicator MT4 is a powerful upgrade to the classic MACD indicator. It allows forex traders to view MACD values from a higher or lower timeframe directly on their current chart. This multi-timeframe capability gives both beginners and experienced traders a clearer view of Trend Strength, momentum changes, and reversal opportunities. By combining traditional MACD signals with higher-timeframe confirmation, the indicator offers more reliable trade setups and reduces false entries.
What Is the MTF MACD Bars Indicator MT4?
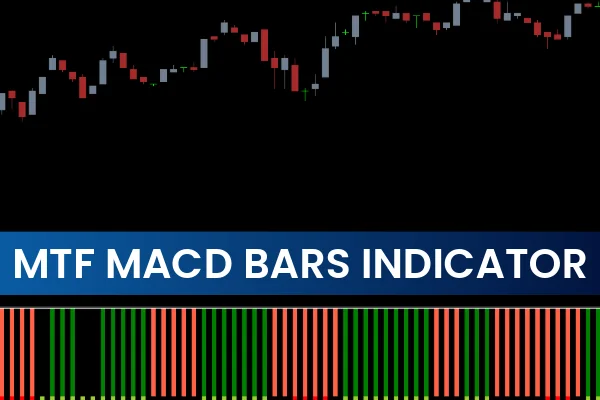
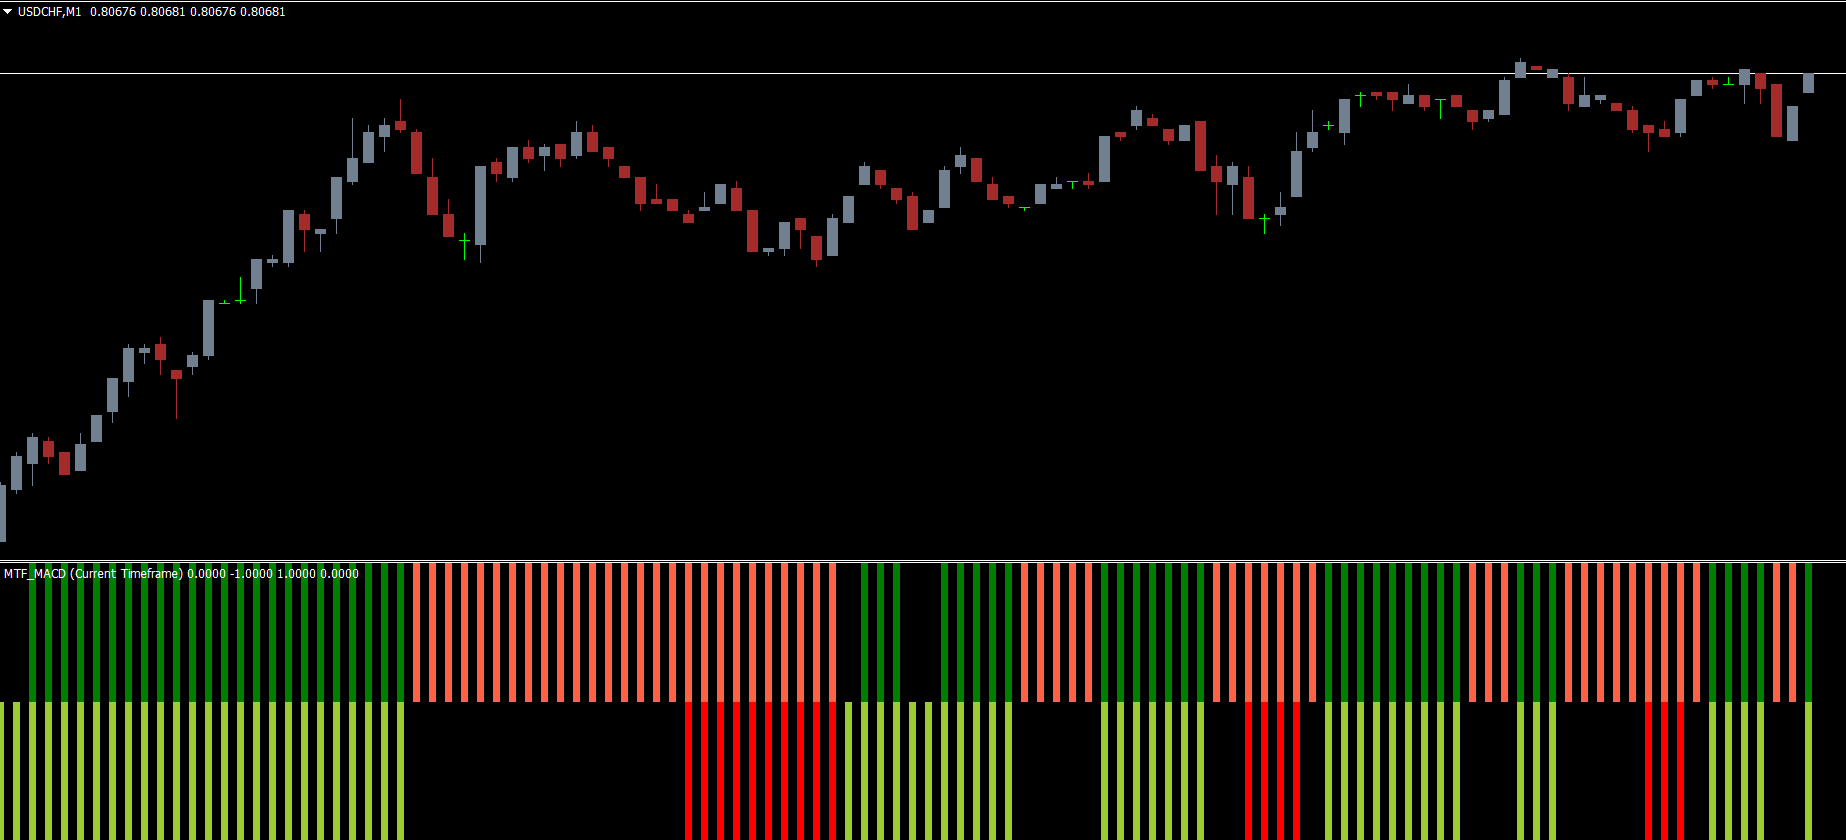
The indicator plots two segments of colored bars inside the indicator window:
Upper segment: displays higher-timeframe MACD data (HTF)
Lower segment: displays current timeframe MACD data (CTF)
This structure allows traders to compare market momentum across multiple timeframes instantly.
Common bar colors include:
YellowGreen / Green → Bullish momentum
TomatoRed / Red → Bearish momentum
This color-coded visualization helps traders assess market direction at a glance.
How the MTF MACD Bars Indicator Works
HTF Bars for Trend Direction
The upper bar section shows the dominant trend from a higher timeframe such as H4 or Daily.
Green/YellowGreen = strong bullish momentum
Red/TomatoRed = strong bearish momentum
CTF Bars for Entry Timing
The lower bar section reflects MACD strength in the active chart timeframe.
Green/YellowGreen bars provide BUY opportunities
Red/TomatoRed bars provide SELL opportunities
When both segments align with the same color, the setup is considered a high-probability trade.
How to Trade with the MTF MACD Bars Indicator MT4
Buy Signals (MTF Trend Alignment)
A BUY trade is valid when:
The lower bars switch to YellowGreen or Green, signaling current timeframe bullish momentum
The upper bars confirm with matching bullish colors, indicating higher-timeframe trend support
This combination means the lower timeframe aligns with the dominant market direction.
Exit Strategy:
Close the BUY position when the bars shift from Green/YellowGreen to Red.
Sell Signals (Momentum Reversal Confirmation)
A SELL trade is confirmed when:
The top bars turn TomatoRed or Red, showing higher-timeframe bearish sentiment
The lower bars match with bearish colors, signaling a strong downward move
Exit Strategy:
Exit when the lower bars shift to YellowGreen or Green.
Trading Higher Timeframes with the MTF MACD Bars Indicator
Identify the Dominant Trend
Use the upper segment to assess the major market bias.
Bullish HTF = preference for long entries
Bearish HTF = preference for short entries
Wait for CTF Confirmation
Entries must align with the current timeframe’s MACD bars. This ensures timing accuracy and helps avoid premature trades.
Synchronize Both Timeframes
Strong setups occur when HTF and CTF colors match. This alignment reflects synchronized momentum, offering the highest probability of Trend Continuation.
Best Practices for MTF MACD Trading
Use Support and Resistance
Combine MACD signals with major support/resistance levels to filter out low-quality entries.
Consider Market Volatility
MACD signals work best in trending or moderately volatile markets. Avoid trading during low-volatility consolidation.
Use Additional Tools for Confirmation
Price Action, trendlines, and moving averages help validate MACD-based entries.
Why Traders Prefer the MTF MACD Bars Indicator
Visual multi-timeframe trend confirmation
Reduced false signals
Clear bullish and bearish transitions
Suitable for intraday and swing trading
Compatible with automated trading systems
Both beginners and advanced traders benefit from its simple, effective, and visually intuitive interface.
Conclusion
The MTF MACD Bars Indicator MT4 provides a significant advantage by displaying MACD momentum across multiple timeframes in one window. This helps traders make more accurate decisions, avoid weak signals, and stay aligned with the dominant market trend. To download more powerful MT4 and MT5 tools, visit IndicatorForest.com and enhance your forex trading strategy today.
FAQ
Published:
Nov 19, 2025 22:42 PM
Category: