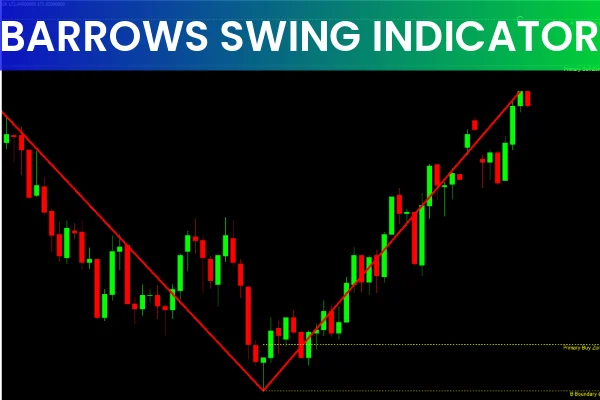
The Barrows Swing Indicator is an advanced MT4 tool designed to help traders identify potential buy and sell zones with high accuracy. This indicator automatically detects swing highs and swing lows, plots extreme levels, and draws the waves X, A, B, C, D, and E, allowing traders to recognize harmonic patterns effortlessly.
Whether you trade forex, indices, or commodities, the Barrows Swing Indicator helps map out major turning points in the market. It works on all timeframes, but its accuracy improves significantly on higher timeframes like H4 or Daily charts. This makes it a powerful tool for both swing traders and long-term analysts.
How the Barrows Swing Indicator Works
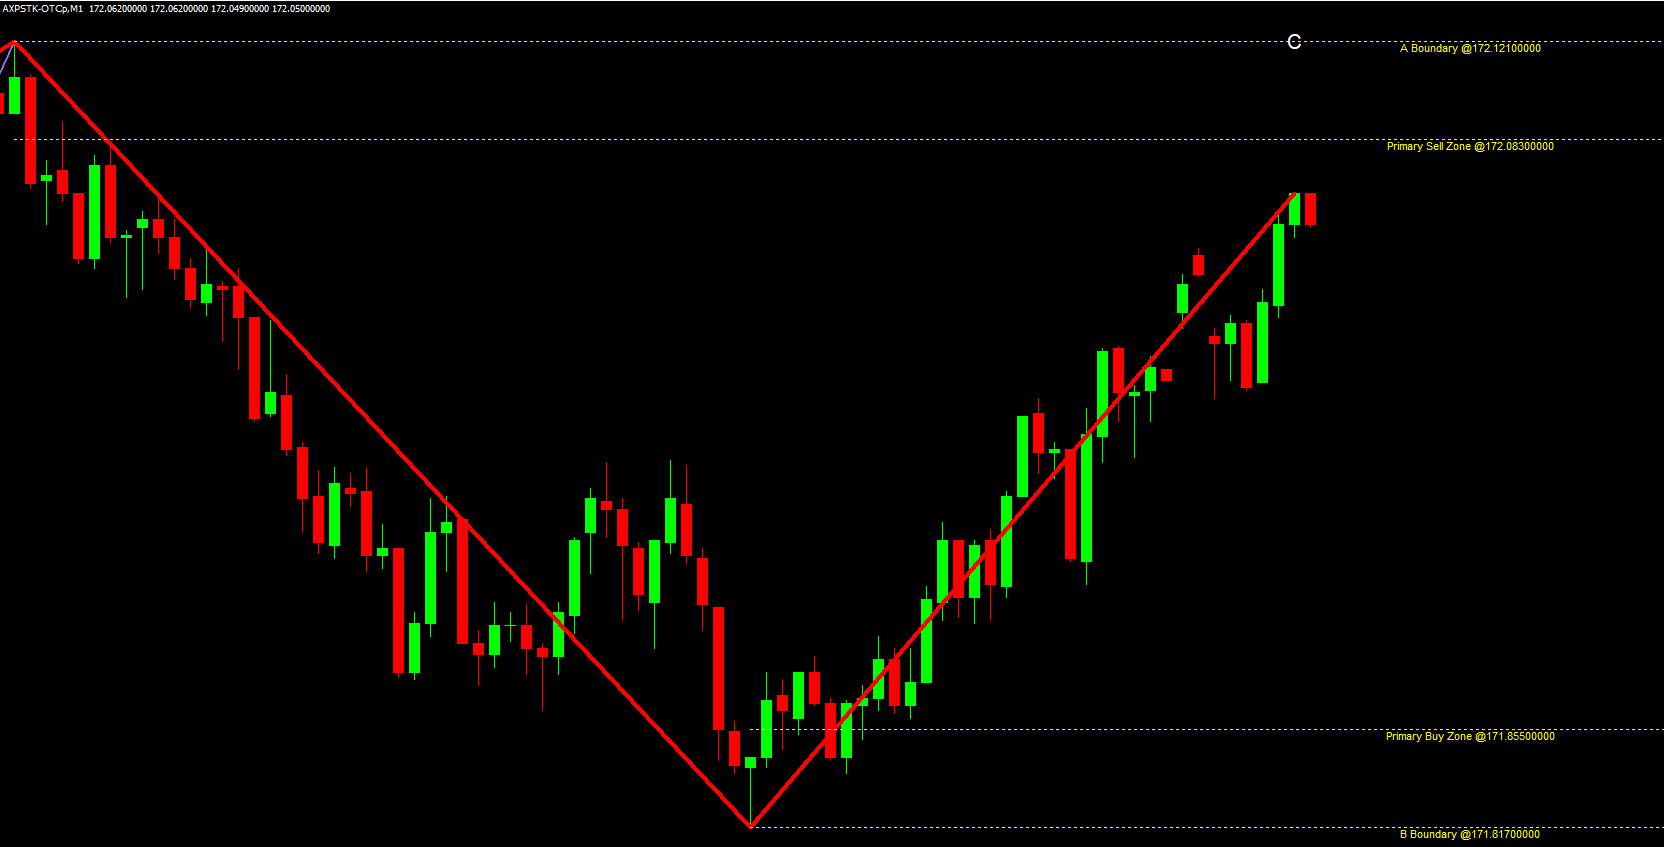
At its core, the indicator identifies price swings and creates visual zones that highlight potential reaction areas. These zones act as high-probability buy and sell regions—helping you anticipate reversals and manage risk effectively.
Here’s what the indicator shows:
Buy Zone – A strong support region where price may reverse upward
Sell Zone – A resistance region where price may reverse downward
Extreme Levels – Additional reference zones used for stop-loss placement
Wave Structure (XABCED) – Helps identify harmonic patterns such as Gartley, Bat, or Crab
These features make the Barrows Swing Indicator useful for discretionary traders, pattern traders, and even algorithmic traders who rely on defined ranges.
How to Use the Barrows Swing Indicator in MT4
Identifying Buy and Sell Zones
In the USDCHF H4 example, the indicator marks a sell zone above the current price and a buy zone below. Traders can set limit orders around these zones:
Sell limit near the sell zone
Buy limit near the buy zone
This allows you to catch reversals without constantly monitoring the chart.
Using Extreme Levels for Stop-Loss
The indicator also plots extreme high and extreme low levels.
These levels serve as ideal stop-loss locations because they represent the furthest price stretches before a reversal.
For buy trades → place SL below the extreme low
For sell trades → place SL above the extreme high
This improves risk management and reduces premature stop-outs.
Harmonic Pattern Trading with X, A, B, C, D, E Waves
Because the indicator automatically plots key swing points (X, A, B, C, D, E), harmonic traders can easily identify:
ABCD patterns
XABCD harmonic structures
Deep retracement zones
Trend exhaustion patterns
Experienced traders can use harmonic confirmation to enter early or filter out low-quality setups.
Position Management Using Swing Waves
When waves develop, you can:
Move stop-loss to the next swing higher or lower
Lock in profits as new waves form
Protect open trades during pullbacks
This method combines price structure with the indicator’s automated swing analysis.
Conclusion
The Barrows Swing Indicator for MT4 is a comprehensive buy/sell zone tool that highlights potential reversal areas, identifies extreme levels, and reveals harmonic wave patterns. Traders can use the plotted zones for entries, rely on extreme levels for stop-loss placement, and apply XABCD waves for deeper pattern analysis.
To download this indicator and explore more professional trading tools, visit IndicatorForest.com today.
FAQ
Published:
Nov 19, 2025 02:32 AM
Category: