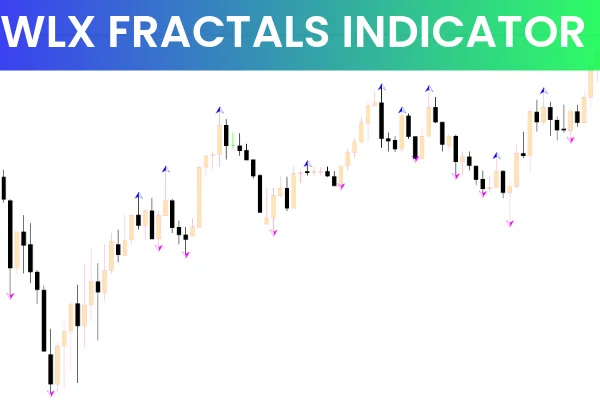
The WLX Fractals indicator is a simplified version of Bill Williams’ renowned Fractal indicator. It helps traders identify shifts in Market Structure and provides clear trend direction signals. The indicator plots red and blue arrows directly on the MT4 chart, showing potential buy and sell zones. This makes WLX Fractals especially helpful for beginners who want a visual and straightforward method of spotting price reversals.
Because fractals form when the market changes momentum, they serve as natural markers of swing highs and lows. In an uptrend, WLX Fractals highlights bullish momentum, while in a downtrend, it shows bearish signals. This makes it an efficient tool for trend-following strategies, breakout traders, and reversal-based systems.
How WLX Fractals Indicator Works
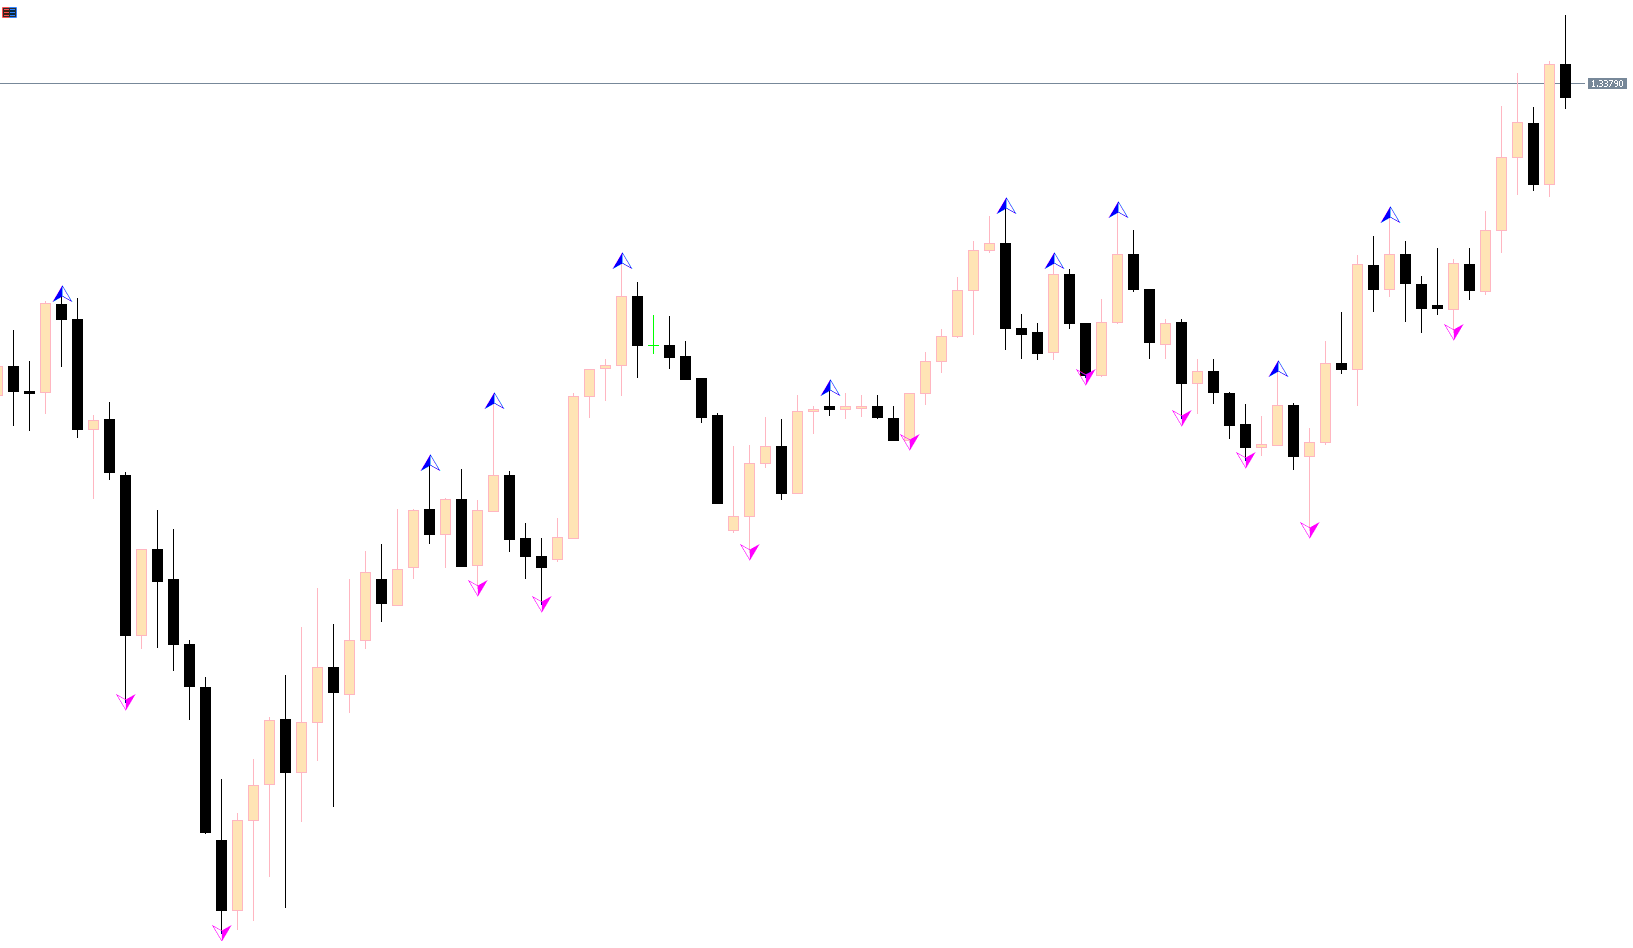
The WLX Fractals indicator displays:
Red arrows → bullish momentum / buy opportunities
Blue arrows → bearish momentum / sell opportunities
These arrows appear when the indicator detects a shift in market patterns and identifies a possible reversal point. Unlike the traditional Williams Fractal, which requires manual pattern inspection, WLX Fractals automates the process and presents a clear signal overlay on the chart.
Left & Right Arrow Logic
The indicator also includes:
Left arrows – show the origin of the fractal formation
Right arrows – confirm the trend continuation
Traders should wait for the arrows to fully develop before entering trades to avoid early entries.
Best Timeframes
Because fractals can appear frequently in volatile markets, the indicator performs best on:
H4
Daily
Weekly
Lower timeframes may generate false signals due to market noise.
How to Trade Using the WLX Fractals Indicator
WLX Fractals Buy Strategy
To trade long positions:
Wait for a red arrow to appear on the chart.
Allow the trend to fully develop—avoid entering on the very first sign of reversal.
Enter a buy order at or soon after the red arrow appears.
Place the stop loss below the recent swing low or below the arrow formation.
Close the position when the next blue arrow appears.
This method ensures that traders align with bullish momentum and avoid entering during early noise or retracements.
WLX Fractals Sell Strategy
For short-selling:
Wait for a blue arrow to appear.
Ensure the trend has clearly shifted before entering.
Enter a sell order on or after the blue arrow.
Place the stop loss above the recent swing high.
Close the trade when the next red arrow appears.
This technique helps traders participate in bearish trends with controlled risk.
Tips for Better Accuracy
While WLX Fractals can work independently, adding confirmation tools increases win probability. You can combine it with:
RSI (Relative Strength Index) – to verify overbought/oversold conditions
MACD – to confirm momentum direction
Moving Averages – to align with long-term trends
These additional filters help eliminate weak fractal signals, especially on higher timeframes.
Why WLX Fractals Is Useful for MT4 Traders
The WLX Fractals indicator:
Helps identify early price reversals
Provides clear entry and exit signals
Works well for trend-following and swing trading
Is beginner-friendly due to its visual arrow system
Reduces chart clutter compared to classic fractal indicators
If you're looking for a simple yet effective trend-detection tool, WLX Fractals is a valuable addition to your MT4 strategy.
Conclusion
The WLX Fractals indicator offers an easy and visual method for detecting market direction using red and blue arrows. It simplifies the process of spotting trend reversals and provides clear buy and sell signals on the chart. While it can operate independently, pairing it with indicators like RSI or MACD helps confirm the validity of each signal. To enhance your trading strategy and access more premium tools, visit IndicatorForest.com.
FAQ
1 Download
Published:
Nov 19, 2025 02:58 AM
Category: