Volume divergence occurs when the price of an asset and its trading volume move in opposite directions. It signals that a trend may be weakening or about to reverse.
Bearish Volume Divergence:
Happens when the price makes higher highs but the volume shows lower highs — indicating reduced buying pressure and a potential downward reversal.
Bullish Volume Divergence:
Occurs when the price forms lower lows while volume shows higher lows, suggesting that sellers are losing momentum and a bullish reversal may follow.
This mismatch between Price Action and volume behavior is crucial for spotting false breakouts and trend exhaustion early.
Why Is Volume Important in Divergence Trading?
Volume is a leading market indicator that reflects trader participation and conviction behind price moves. When price moves sharply but volume doesn’t confirm it, the move is often unsustainable.
That’s why volume-based divergence indicators like this one are considered more reliable than traditional tools such as MACD, RSI, or Stochastic Oscillator. While those focus on momentum, the Price Volume Divergence Indicator reveals whether real market participation supports a price move.
This makes it an excellent tool for:
Intraday/day trading
Swing trading
It’s also suitable for beginners and experienced traders, thanks to its simple yet powerful visual interface.
How to Trade Using the Price Volume Divergence Indicator
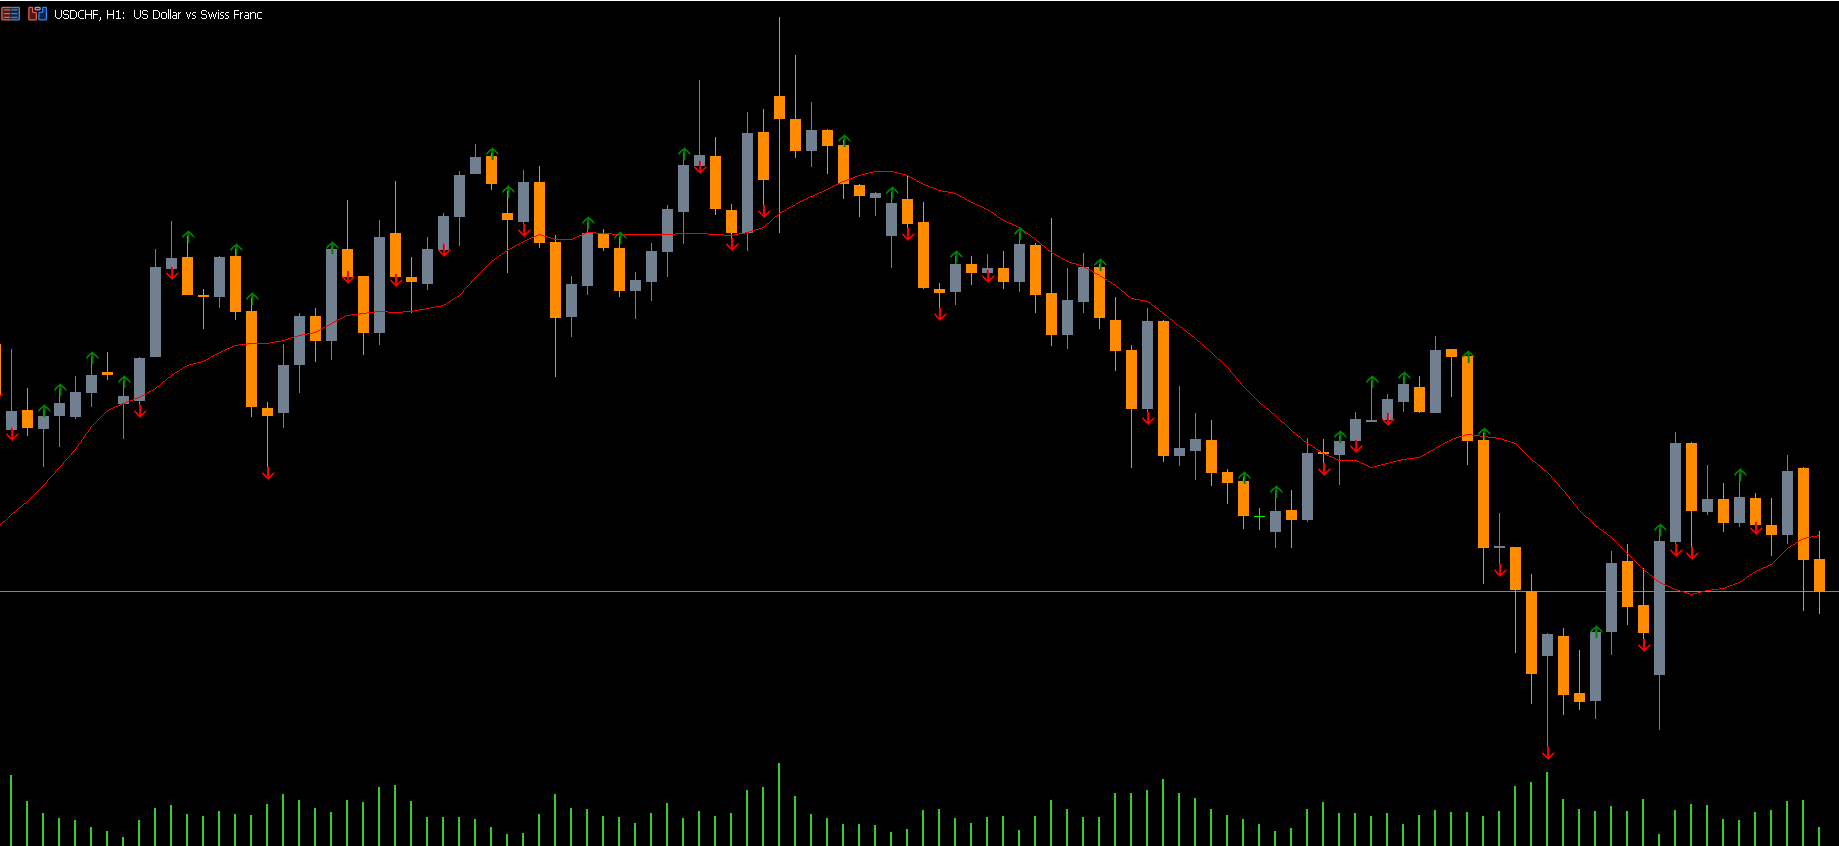
Once added to your MT5 chart, the Price Volume Divergence Indicator visually highlights bullish and bearish divergence zones.
BUY Signal
Identify a bullish divergence — price makes a lower low while volume makes a higher low.
Confirm the setup with price action signals, such as a bullish engulfing or pin bar pattern.
Enter a BUY (LONG) position aligned with the bullish move.
Place a stop-loss below the recent swing low.
SELL Signal
Spot a bearish divergence — price forms higher highs while volume forms lower highs.
Confirm the signal using Candlestick Patterns or other technical indicators (like moving averages).
Open a SELL (SHORT) position following the downtrend.
Set your stop-loss above the recent swing high.
For best results, combine this indicator with Support And Resistance levels or trend analysis to filter false signals and improve accuracy.
Advantages of the Price Volume Divergence Indicator
Detects early market reversals before they are visible on standard indicators.
Works on multiple timeframes and any currency pair or asset.
Provides clear visual divergence zones directly on the chart.
Enhances accuracy when used with price action strategies.
Ideal for manual and automated trading systems.
Conclusion
The Price Volume Divergence Indicator for MT5 is a highly effective technical tool that combines the best of volume and price analysis to identify hidden reversals and confirm Trend Strength.
By revealing when price movement is not supported by trading volume, it gives traders a significant edge in timing entries and exits.
📈 Download the Price Volume Divergence Indicator for free today at IndicatorForest.com and start detecting true market reversals with precision and confidence.
FAQ
1 Download
Published:
Nov 10, 2025 03:25 AM
Category: