The VIP Dynamic Support Resistance Indicator MT5 is one of the most accurate and reliable tools for identifying dynamic Support And Resistance zones in trending markets. Unlike traditional horizontal or diagonal support/resistance levels, dynamic levels move with the price. This provides traders with real-time insights into evolving market structure, significantly improving timing for entries, exits, and trend reversals.
This indicator automatically calculates historical price behavior and projects dynamic zones that adapt to current market momentum. These zones often act as reaction points, where price may reverse, bounce, or continue in the direction of the trend. Because of this adaptive nature, the VIP Dynamic Support Resistance Indicator consistently outperforms conventional moving-average-based strategies and static support/resistance tools.
How Dynamic Support and Resistance Works
Traditional support and resistance levels remain fixed until they are redrawn. In contrast, dynamic support/resistance levels shift continuously, reflecting the live structure of the market. They are particularly powerful in trending conditions because they follow price movement inside a trend channel, offering smoother, more precise interaction zones.
Why Dynamic Levels Are More Accurate
They move with the market
They help identify real-time Trend Strength
They highlight where price is most likely to react
They adjust during volatility, unlike static lines
Dynamic levels are ideal for traders who want automated, adaptable market guidance.
How the VIP Dynamic Support Resistance Indicator MT5 Works
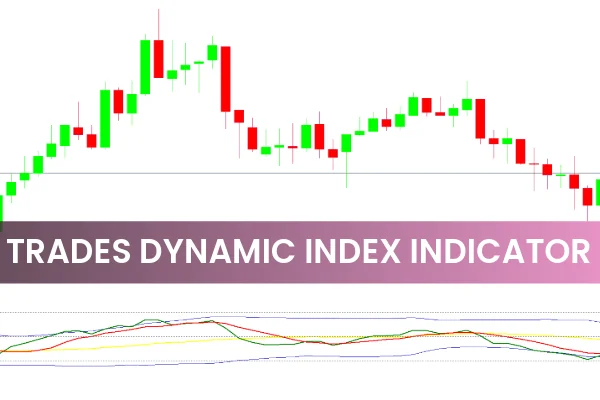
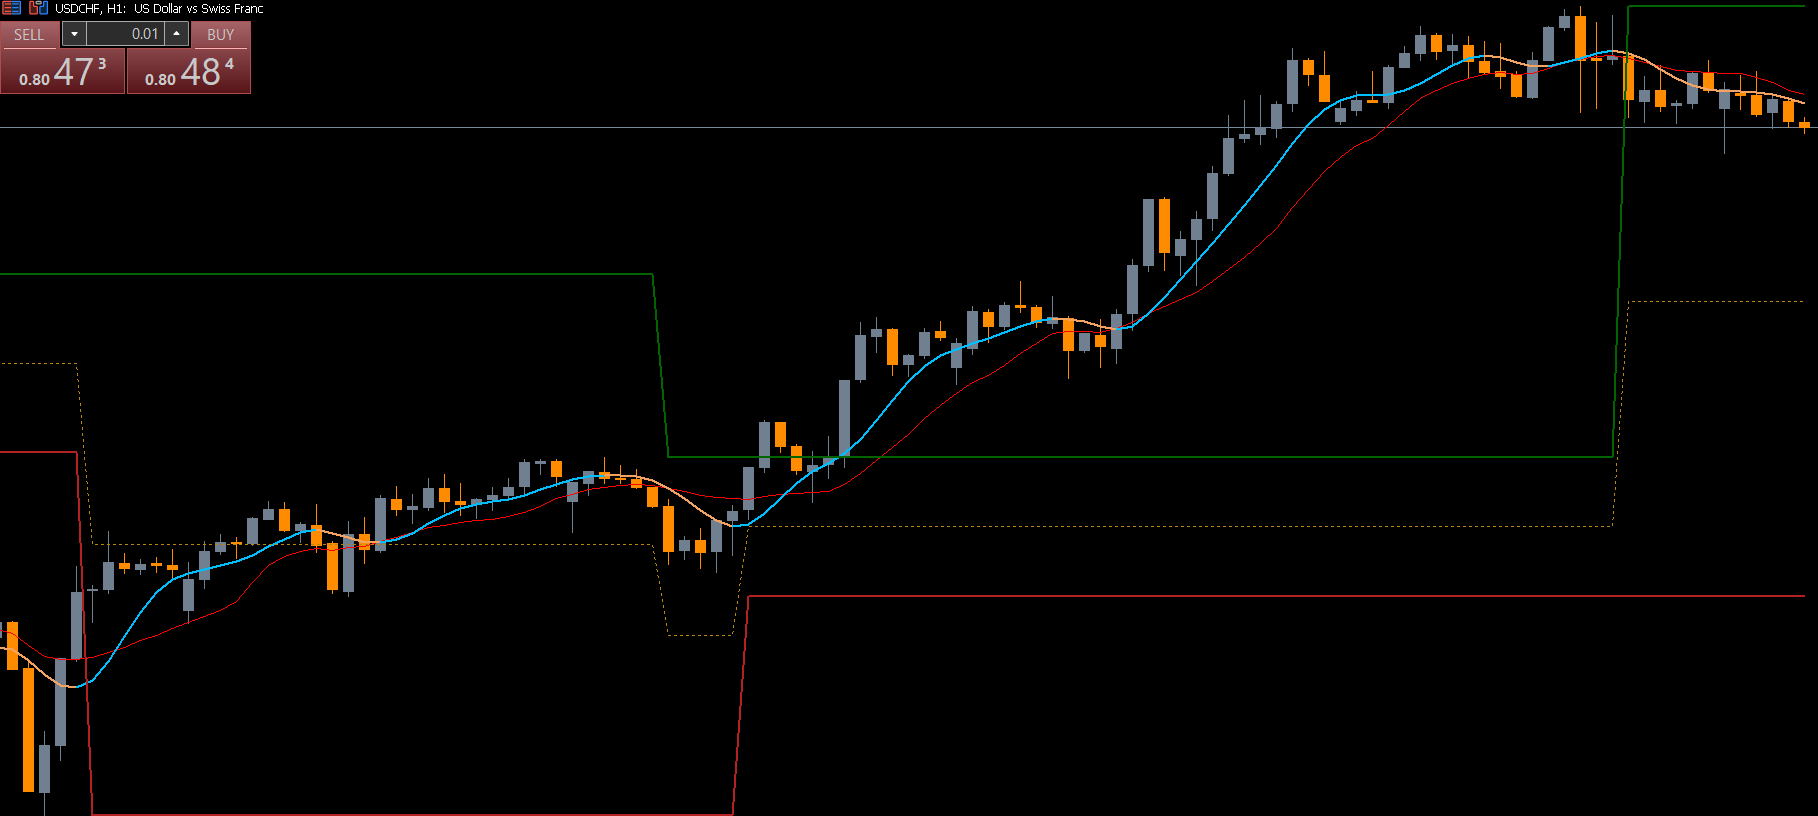
The indicator analyzes historical price data to determine how price interacts with moving support and resistance zones. It then plots three key lines on the chart:
Dark Green Line → Dynamic Resistance
Firebrick Line → Dynamic Support
Dark Gold Dotted Lines → Average Support/Resistance Zones
These adaptive levels help traders track trend movement as price travels through the market. The dotted lines often act as the first level of reaction, while the firebrick and dark green lines mark major dynamic turning points.
How to Trade Using the VIP Dynamic Support Resistance Indicator
Trading With Dynamic Support
When price pulls back to the dynamic support (firebrick line or dotted average), traders look for bullish signals such as:
Double bottoms
Pin bars
Bullish engulfing patterns
Break of neckline structures
For example, when a double bottom forms on the dotted dynamic support line, a buy setup is triggered once the neckline breaks. This combines both dynamic support and classic Price Action for a high-probability entry.
Buy Entry Rules
Wait for a bullish pattern at dynamic support
Enter when confirmation candle closes
Place stop loss below dynamic support
Target next resistance or mid-channel
Trading With Dynamic Resistance
When price rises to the dynamic resistance (dark green line), look for:
Rejection candles
Lower highs
Bearish engulfing patterns
Break of support after deviation
A valid sell signal occurs when price rejects the dynamic resistance and breaks below the average bands, signaling bearish momentum.
Sell Entry Rules
Wait for reversal confirmation
Enter sell after breakdown from resistance zone
Set stop loss above dynamic resistance
Target the opposite band or support line
Best Ways to Use the Indicator for Higher Accuracy
Combine With Price Action
Price action patterns such as double tops, double bottoms, engulfing candles, and trendline breaks significantly enhance accuracy.
Use the Indicator on Preferred Timeframes
Scalping: M1, M5, M15
Day Trading: M30, H1
Swing Trading: H4, Daily
Dynamic support/resistance works well across all these styles.
Trade With the Trend
Dynamic S/R zones perform exceptionally in trending conditions. Avoid heavy ranging markets where false signals may increase.
Conclusion
The VIP Dynamic Support Resistance Indicator MT5 is one of the most powerful tools for identifying real-time support and resistance in trending markets. By adapting to price movement and highlighting areas of potential reversals, it helps traders achieve far more accurate entries and exits than traditional static levels. Easy to use and fully customizable, this MT5 indicator is suitable for scalpers, day traders, and swing traders.
For more premium MT4/MT5 indicators and expert trading guides, visit IndicatorForest.com today.
FAQ
2 Downloads
Published:
Nov 20, 2025 23:00 PM
Category: