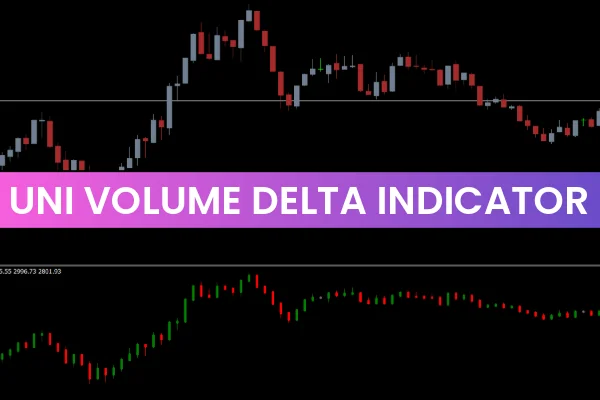
The Uni Volume Delta Indicator for MT4 is a simple yet highly informative technical tool designed to visualize market volume directly on the price chart. Instead of using a separate indicator window, it displays colored bars—similar to candlesticks—to reveal bullish, bearish, and neutral volume conditions. This makes it easy for forex traders to interpret market pressure, momentum, and potential trend reversals at a glance.
Whether you are a beginner or an intermediate trader, the Uni Volume Delta indicator helps you see how market participants are acting behind each candle. By combining Price Action with volume delta information, traders can gain insight into the strength behind each move.
What Is the Uni Volume Delta Indicator for MT4?
The Uni Volume Delta indicator plots three types of bars based on trading volume:
Green Bar – Bullish Volume
A green bar indicates that bullish pressure is dominating, meaning buyers are more active in the market.
Red Bar – Bearish Volume
A red bar signals bearish volume, implying sellers are controlling the market.
Neutral Bar – Low or Uncertain Volume
A neutral bar appears when volume is weak or indecisive, often indicating consolidation or a potential pause before a reversal.
Because these bars visually resemble candlesticks, traders can interpret volume behavior naturally, just as they analyze standard price candles.
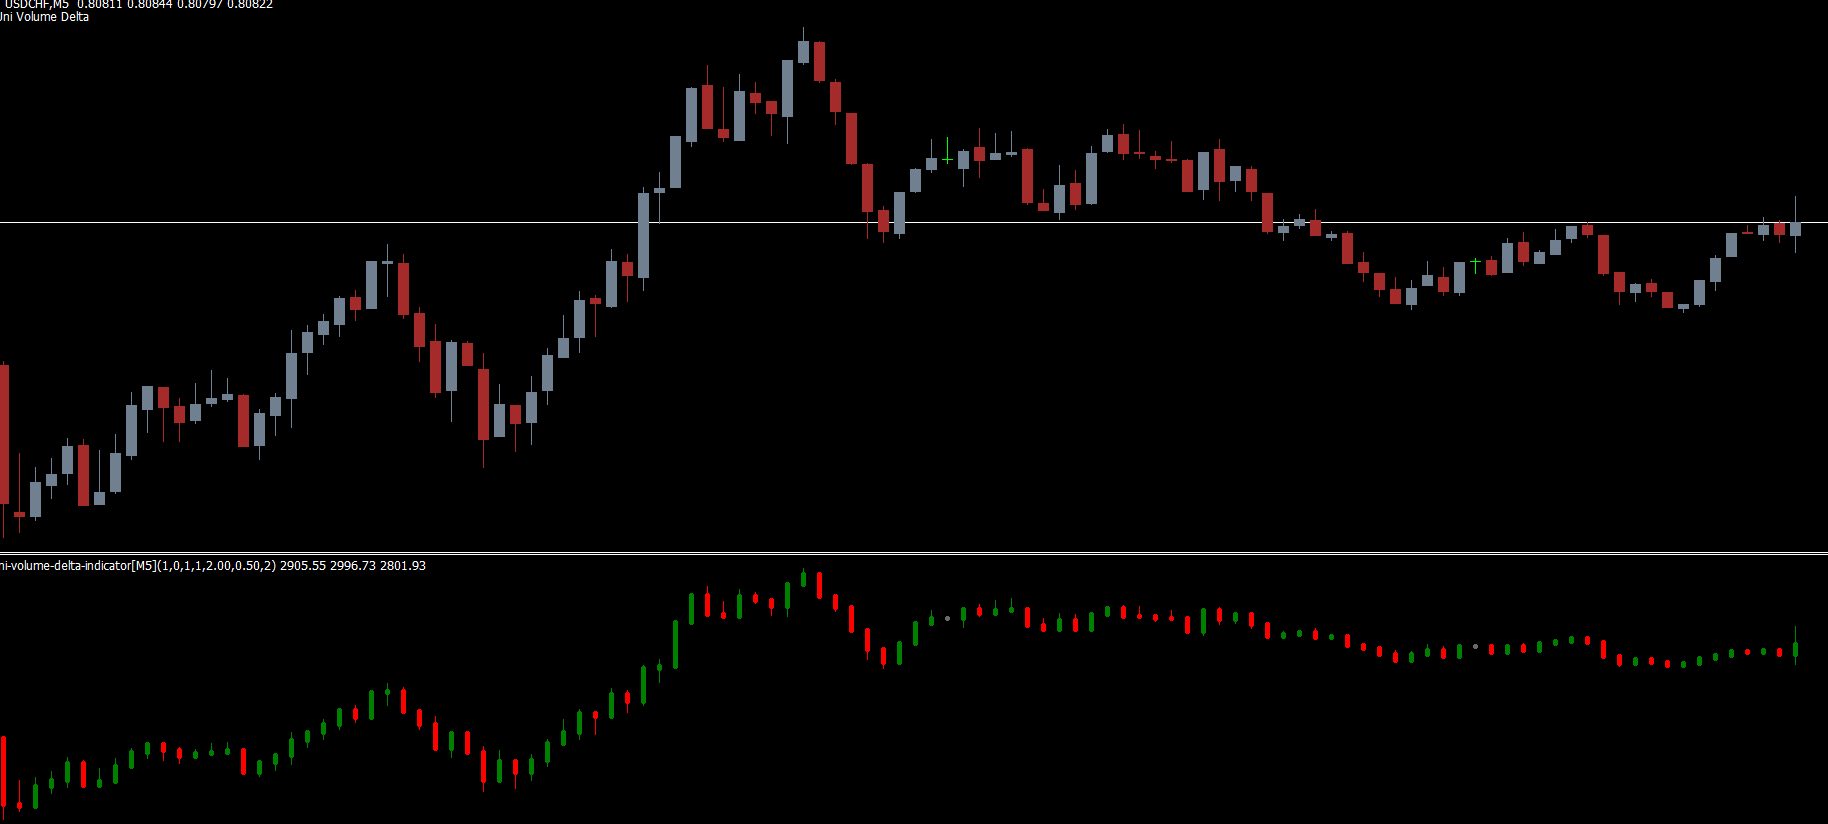
How the Uni Volume Delta Indicator Works
The indicator measures buy and sell volume and then displays it as a bar on the price chart. Since it aligns visually with existing candlesticks, traders can easily recognize patterns such as:
Volume spikes during breakouts
Weak volume during consolidation
Divergence between price action and volume delta
Trend Continuation or trend exhaustion signals
This makes the Uni Volume Delta indicator valuable when combined with other tools, such as RSI, Stochastic, Moving Averages, or support/resistance zones.
How to Trade Using the Uni Volume Delta Indicator
Although useful on all timeframes, the Uni Volume Delta indicator is especially effective for short-term strategies, such as Scalping and day trading. This is because shorter timeframes rely heavily on volume dynamics and momentum.
Below are detailed buy and sell setups:
Buy Strategy (Long Setup)
Locate a green bar indicating bullish volume dominance.
Wait for price direction confirmation, such as a higher low or bullish candle formation.
Enter a buy trade at the appearance of a stable green bar.
Set stop-loss near the low of the signal bar or nearest support zone.
Exit the trade when a red bar or bearish volume appears, signaling a potential reversal.
This approach works best when combined with other indicators or price patterns such as bullish engulfing, RSI oversold conditions, or moving average crossovers.
Sell Strategy (Short Setup)
Locate a red bar representing strong bearish volume.
Wait for price confirmation, such as a lower high or bearish candle.
Enter a sell trade once a clear red bar forms.
Place stop-loss near the high of the signal bar or nearest resistance.
Exit the trade when a green bar appears, suggesting buyers are returning.
Using this method helps avoid false signals and improves accuracy when combined with RSI, MACD, or a trendline break.
Best Timeframes and Trading Tips
Works best on M1, M5, M15 for scalping
Use on H1 or H4 for confirmation but expect fewer signals
Avoid trading during low-volume sessions (Asian session for many pairs)
Always use a stop-loss to protect against unexpected volatility
Combine Uni Volume Delta with trend indicators for stronger setups
Conclusion
The Uni Volume Delta Indicator for MT4 is a powerful tool for understanding price strength and market sentiment. By visualizing bullish, bearish, and neutral volume directly on the chart, traders can make more informed decisions regarding entries and exits. While it works on all timeframes, it’s particularly effective for short-term trading strategies such as scalping and day trading.
To explore more free trading indicators and powerful MT4 tools, visit IndicatorForest.com today.
FAQ
6 Downloads
Published:
Nov 22, 2025 12:00 PM
Category: