The Bollinger Bands Relative Strength Index (BBR RSI) is a powerful custom indicator for MetaTrader 4 (MT4) that combines the analytical strength of Bollinger Bands and the Relative Strength Index (RSI). By merging these two classic technical indicators, traders can more accurately identify overbought and oversold market conditions—essential for timing entries and exits with higher precision.

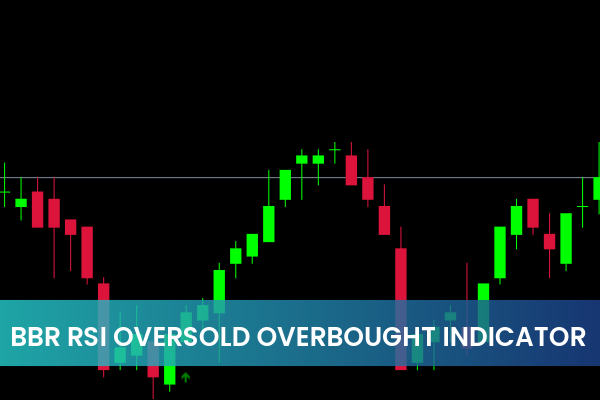
This tool provides visual trading cues in the form of green and red arrows that appear directly on the chart, making it user-friendly for traders of all experience levels.
How the BBR RSI Indicator Works
The BBR RSI Indicator works by overlaying RSI data with Bollinger Bands. It identifies moments when the RSI and Price Action simultaneously indicate an extreme condition:
Red Arrow (Sell Signal): Appears when price touches the upper Bollinger Band and RSI enters the overbought zone. This suggests a potential downward reversal.
Green Arrow (Buy Signal): Appears when price reaches the lower Bollinger Band and RSI drops into the oversold zone, signaling a possible upward movement.
By combining these two factors, the indicator enhances the reliability of traditional RSI readings, reducing false signals caused by short-term market volatility.
How To Use the BBR RSI Oversold Overbought Indicator for MT4
1. Identifying Entry Points
When the BBR RSI indicator shows a red arrow, it indicates that the market may be overbought. This is typically a good time to consider short (sell) positions, especially if the candle confirms a downward move.
Conversely, when a green arrow appears, it means the market is oversold. This may be a signal to go long (buy) as the price could rebound upward.
2. Confirming Market Momentum
Use the BBR RSI indicator alongside trend-following tools such as Moving Averages or ADX to confirm the strength of the signal. This helps avoid entering trades against the major market trend.
3. Setting Stop Loss and Take Profit
To manage risk effectively:
Place Stop Loss above the recent high (for sell trades) or below the recent low (for buy trades).
Use Bollinger Band levels or key support/resistance zones for Take Profit targets.
4. Timeframe and Asset Selection
The BBR RSI performs best on short- to medium-term timeframes (M15, M30, H1). It can be applied to any market—forex, indices, commodities, or cryptocurrencies—making it a versatile addition to any trading strategy.
Why Traders Prefer the BBR RSI Indicator
✅ Combines Two Trusted Indicators – Merges RSI and Bollinger Bands for higher signal accuracy.
✅ Visual Simplicity – Red and green arrows make trading decisions quick and intuitive.
✅ Works on All Assets – Useful for forex, stocks, indices, and crypto markets.
✅ Improves Timing – Helps traders catch trend reversals early and avoid false breakouts.
Practical Example
Imagine EUR/USD is trending upward but reaches the upper Bollinger Band while RSI exceeds 70. The indicator shows a red arrow, signaling that the pair is likely overbought. Traders may choose to enter a short position, anticipating a correction.
Later, when the price touches the lower Bollinger Band and RSI drops below 30, a green arrow appears—indicating a possible bounce. This is a cue for a long position, capitalizing on the market’s rebound potential.
Conclusion
The Bollinger Bands Relative Strength Index (BBR RSI) is an excellent technical tool for traders who want a clear and accurate view of overbought and oversold conditions. By merging the strength of Bollinger Bands with RSI, this indicator provides timely buy and sell signals that can enhance any trading strategy.
To download and learn more about this indicator, visit IndicatorForest.com and explore our collection of advanced MT4 and MT5 tools designed to help you trade smarter.
5 Downloads
Published:
Nov 03, 2025 08:56 AM
Category: