The Triple Exponential Moving Average Indicator (TEMA) is a powerful trend-following tool designed to reduce lag and respond more quickly to Price Action than standard moving averages like SMA and EMA. By giving stronger weight to the most recent price data, the TEMA provides a smoother, more accurate reflection of real-time market movement. Traders use the TEMA to identify trend direction, filter noise, and detect potential turning points with greater precision.
Unlike traditional moving averages, the Triple Exponential Moving Average applies exponential smoothing three times. The triple-layered smoothing reduces lag significantly and keeps the indicator in tighter alignment with price movements. This makes the TEMA highly responsive while still keeping the chart clean and structured—a valuable advantage in volatile markets.
Why TEMA Eliminates Lag and Improves Trend Detection
Traditional moving averages tend to react slowly because they must account for large amounts of historical data. TEMA corrects this by subtracting the exponential moving average three times, aligning indicator values more closely with the actual price. The result is a highly reactive, low-lag indicator that moves in tandem with the current trend.
When price rises, the TEMA line slopes upward, and when price falls, the TEMA slopes downward. This simplicity makes it easy for traders to evaluate Trend Strength and direction quickly. Unlike noisy price action alone, the TEMA filters unnecessary fluctuations, helping traders avoid false signals and emotional entries.
How to Use the Triple Exponential Moving Average Indicator
TEMA works effectively on all timeframes—Scalping charts like M1–M5, intraday charts like M15–H1, and long-term charts such as H4 or Daily. Whether you trade forex, stocks, commodities, or crypto, the indicator adapts well to various instruments and strategies.
For the most accurate results, traders often combine TEMA with complementary tools such as RSI, MACD, or trendline analysis. This multi-layered approach helps confirm entries, avoid whipsaw signals, and increase long-term system reliability.
How to Identify Trading Signals with TEMA
Buy Signal
A buy signal occurs when the TEMA line turns red and slopes upward.
This indicates bullish momentum and suggests it may be a favorable time to go long.
Entry: Enter a long position when the TEMA changes color to red during rising price conditions.
Exit: Close the trade when the TEMA line switches to green, signaling that momentum may be shifting.
Sell Signal
A sell signal appears when the TEMA line turns green during a downtrend.
Entry: Enter a short position as the TEMA shifts to green and begins to slope downward.
Exit: Exit the trade once the line changes back to red, indicating bullish strength.
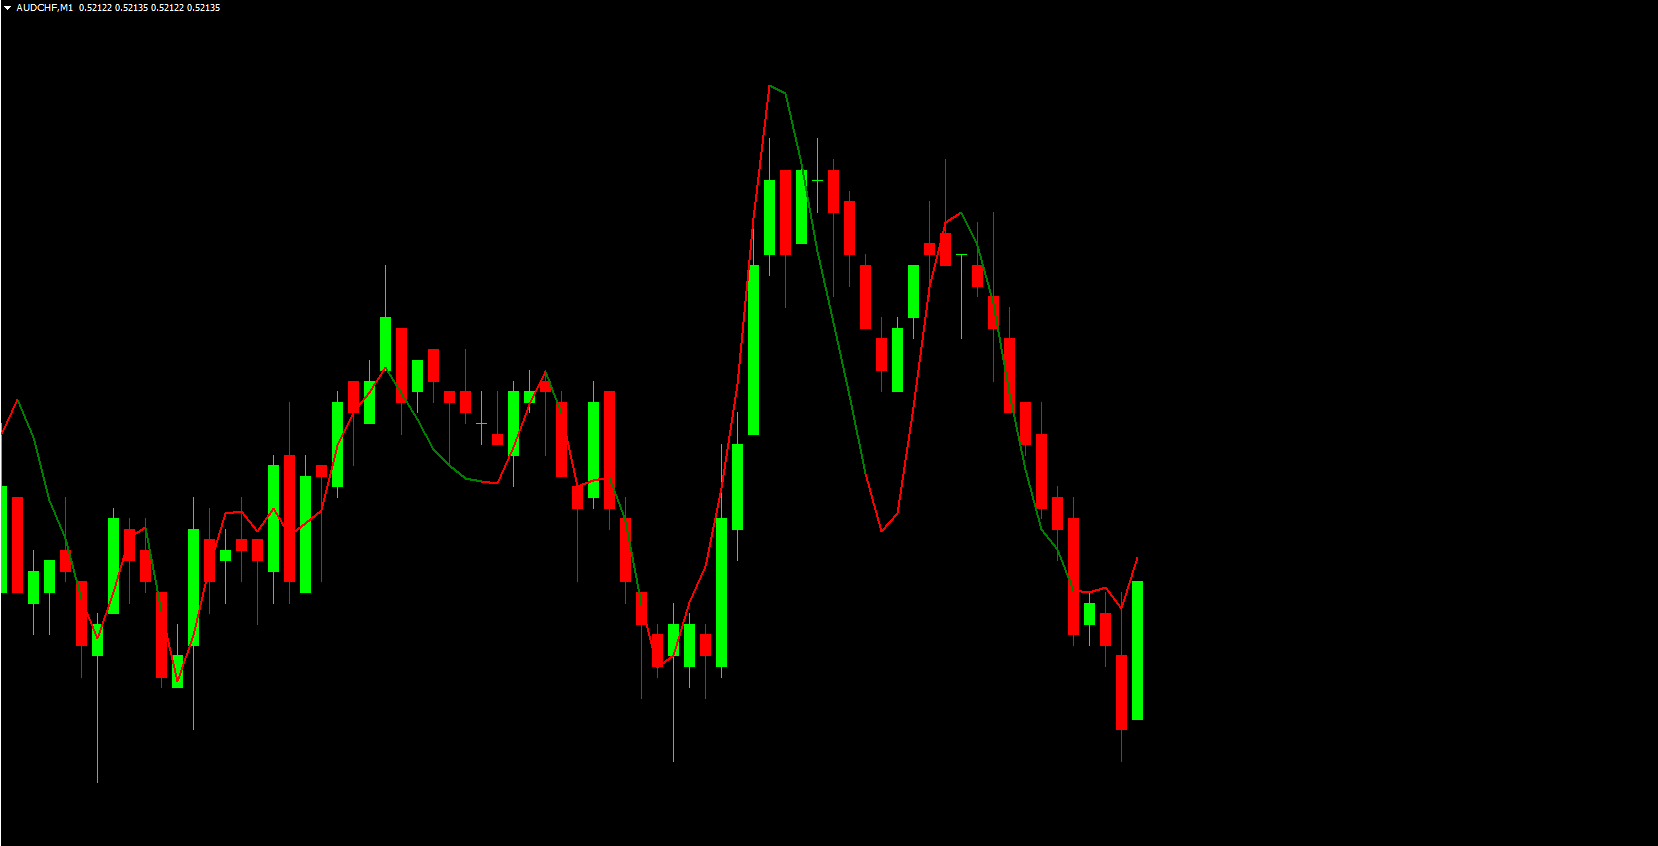
TEMA Real Market Trading Example
Consider a chart of USD/JPY. Price action often creates misleading signals when viewed alone—single bearish or bullish candles do not always indicate a true trend. TEMA helps filter these fluctuations by maintaining close alignment with market direction.
During a downtrend, the TEMA line turning green signals continuation of bearish movement. Conversely, when the line turns red, it highlights the potential beginning of a bullish reversal. This simple visual cue helps traders avoid premature entries and trade confidently in the direction of the prevailing trend.
Conclusion
The Triple Exponential Moving Average Indicator is a highly effective tool for trend identification. By smoothing price three times and eliminating lag, it delivers faster and more accurate signals than both SMA and EMA. Traders only need to watch the color and slope of the line to identify buy and sell opportunities. Whether you are a beginner or an advanced trader, TEMA is an excellent addition to a trend-following system.
To explore more advanced indicators and trading tools, visit IndicatorForest.com and browse our complete library.
FAQ
26 Downloads
Published:
Nov 22, 2025 08:13 AM
Category: