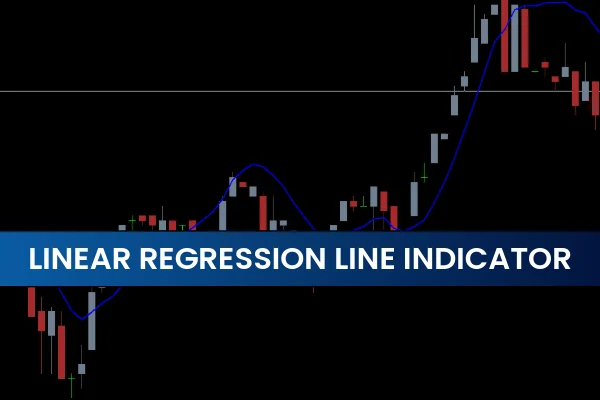
The Linear Regression Line Indicator for MT4 is one of the most reliable trend-following tools used in forex trading. Designed to measure trend direction, momentum, and volatility, this indicator helps traders define market bias with greater precision. The Linear Regression Line Indicator works similarly to a moving average but is created through advanced mathematical algorithms that calculate linear regression of the price. As a result, traders receive a dynamic trend-tracking tool that reacts quickly while remaining smooth and stable.
This indicator is versatile enough to be used by beginners, intermediate traders, and experienced technical analysts. It performs well in multiple trading styles, including scalping, day trading, intraday analysis, and swing trading. Whether you want to understand overall market direction or combine Price Action with trend signals, this indicator provides clarity.
What Is the Linear Regression Line Indicator?
The Linear Regression Line is a mathematical tool that plots the “line of best fit” based on recent price movements. Instead of calculating simple averages like a moving average, it uses regression formulas to determine the natural direction of price over a selected period.
Key Characteristics
Smooth and stable trend representation
Reduces noise during choppy market conditions
Highlights the underlying momentum
Works across all timeframes
Easy to interpret for all skill levels
Because it acts like a statistically-optimized moving average, the indicator reveals Trend Strength and direction more accurately than many traditional indicators.
Is the Linear Regression Line a Good Indicator?
Yes—many traders consider the Linear Regression Line one of the most accurate and dependable trend tools. Here’s why:
Perfect for Identifying Trend Bias
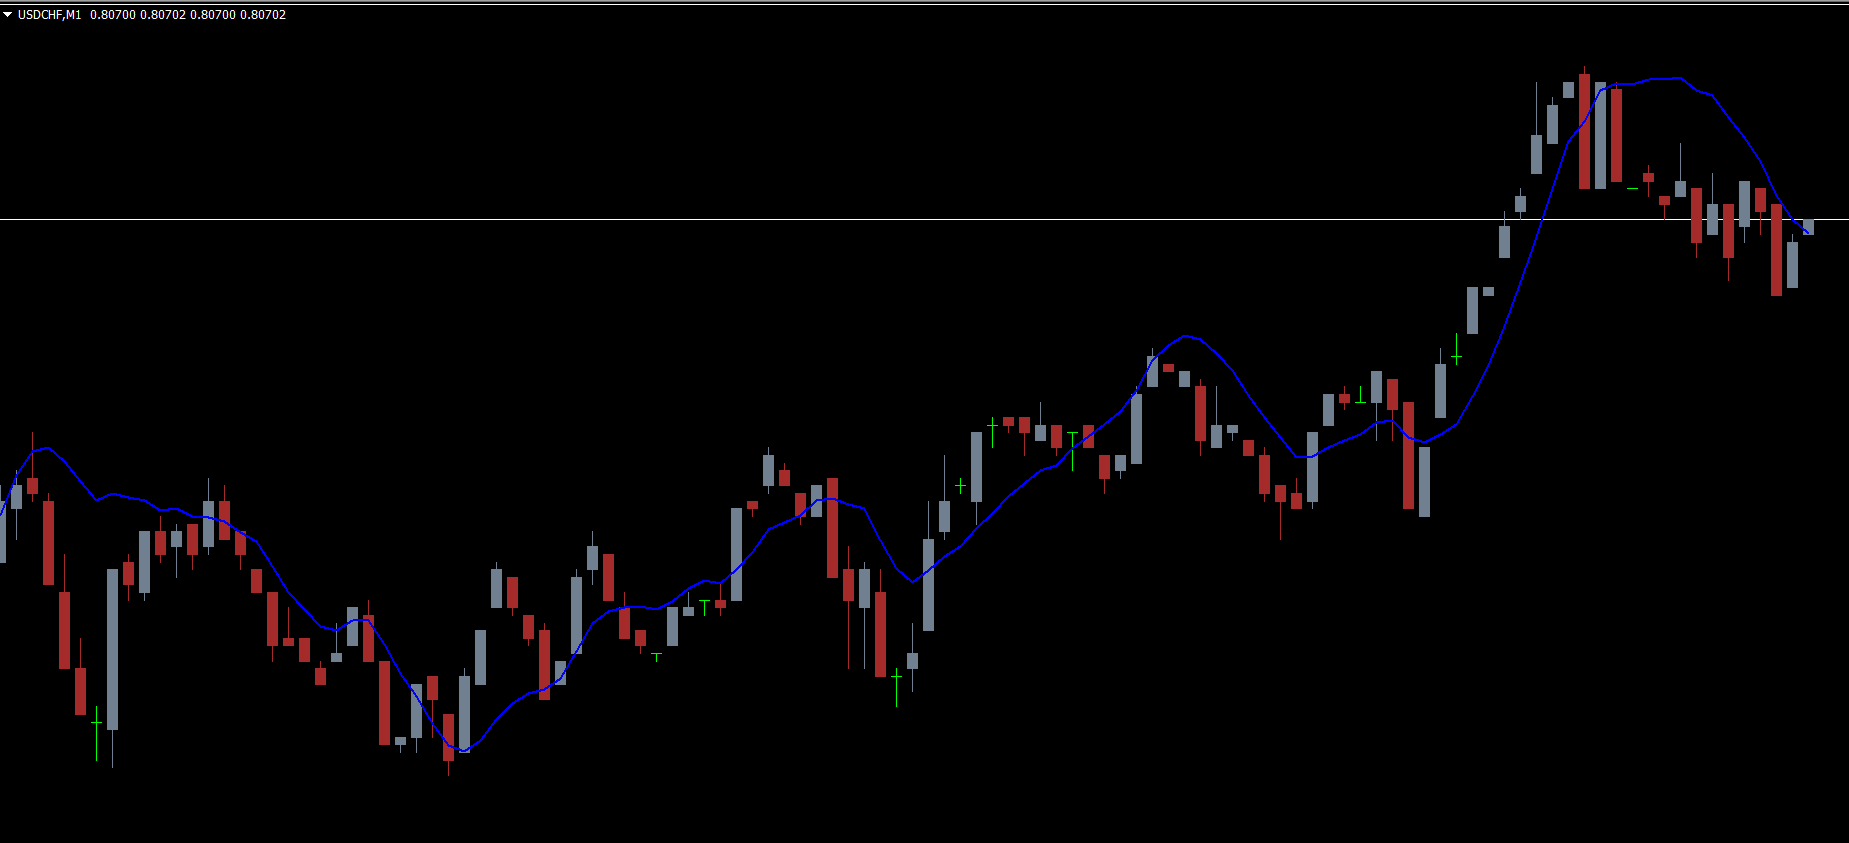
When the price stays above the line, the trend is bullish. When it stays below, the trend is bearish. This simple visual behavior helps traders avoid counter-trend mistakes.
Valuable for Momentum Analysis
The steepness of the line shows how strong the momentum is.
A sharply rising line = strong bullish momentum
A sharply falling line = strong bearish momentum
A flat line = ranging or consolidating market
Suitable for All Trading Styles
Traders use the Linear Regression Line for:
Intraday trading
Day trading
Swing trading
Trend-following strategies
Beginner-Friendly and Fast to Interpret
Its simple visual approach makes it ideal even for new forex traders trying to identify trend direction at a glance.
How to Trade Using the Linear Regression Line Indicator
The indicator performs best when combined with price action, candlestick confirmation, or additional technical tools.
BUY Setup – How to Enter Long Trades
A BUY signal is triggered when:
Price crosses above the Linear Regression Line
A bullish candlestick pattern appears (e.g., bullish engulfing, hammer, pin bar)
Market Structure supports an upward continuation
Price stays above the line, showing sustained bullish strength
Traders may place a stop loss below the recent swing low to protect the position.
SELL Setup – How to Enter Short Trades
A SELL signal is triggered when:
Price crosses below the regression line
A bearish candlestick pattern appears (e.g., bearish engulfing, shooting star)
The market forms lower highs and lower lows
Price remains below the regression line, indicating strong bearish pressure
Stop losses should be placed above the recent swing high.
Tips for Best Trading Results
To improve accuracy, traders should consider:
Combine with Price Action
Use support, resistance, trendlines, and candlestick patterns to filter bad trades.
Use Multiple Timeframes
Identify the main bias on a higher timeframe (H4 or Daily), then enter on a lower timeframe.
Avoid Low-Momentum Periods
Linear regression signals are more effective during clear trends, not ranging markets.
Conclusion
The Linear Regression Line Indicator for MT4 is an effective, easy-to-use Trend Indicator that helps traders identify market direction with superior accuracy. Whether you're new to forex or an advanced trader, this indicator simplifies trend analysis and enhances decision-making. Best of all, you can download the Linear Regression Line Indicator for free at IndicatorForest.com.
FAQ
2 Downloads
Published:
Nov 19, 2025 23:02 PM
Category: