The SHI Channel True Indicator for MT4 is a powerful trading tool that utilizes a Fractal-based strategy to identify significant price highs and lows, creating a visual price channel on the chart. This indicator helps traders recognize trend direction, support and resistance levels, and potential breakout points with high accuracy.
By automatically drawing an upper line, lower line, and dotted middle line, the SHI Channel True Indicator gives traders a clear overview of Market Structure and price boundaries. It’s particularly useful for trend-following and breakout trading strategies.
How the SHI Channel True Indicator Works
The SHI Channel True Indicator determines its channel lines using fractal analysis.
Fractals are specific points on a chart where the price forms local highs (peaks) or lows (valleys) surrounded by smaller highs or lows.
The indicator connects these fractals to create the upper and lower channel boundaries.
The dotted middle line acts as a dynamic equilibrium or trend reference point.
These three lines move together to form a channel that visually represents Price Action and potential turning points in the market.
How to Use the SHI Channel True Indicator for MT4
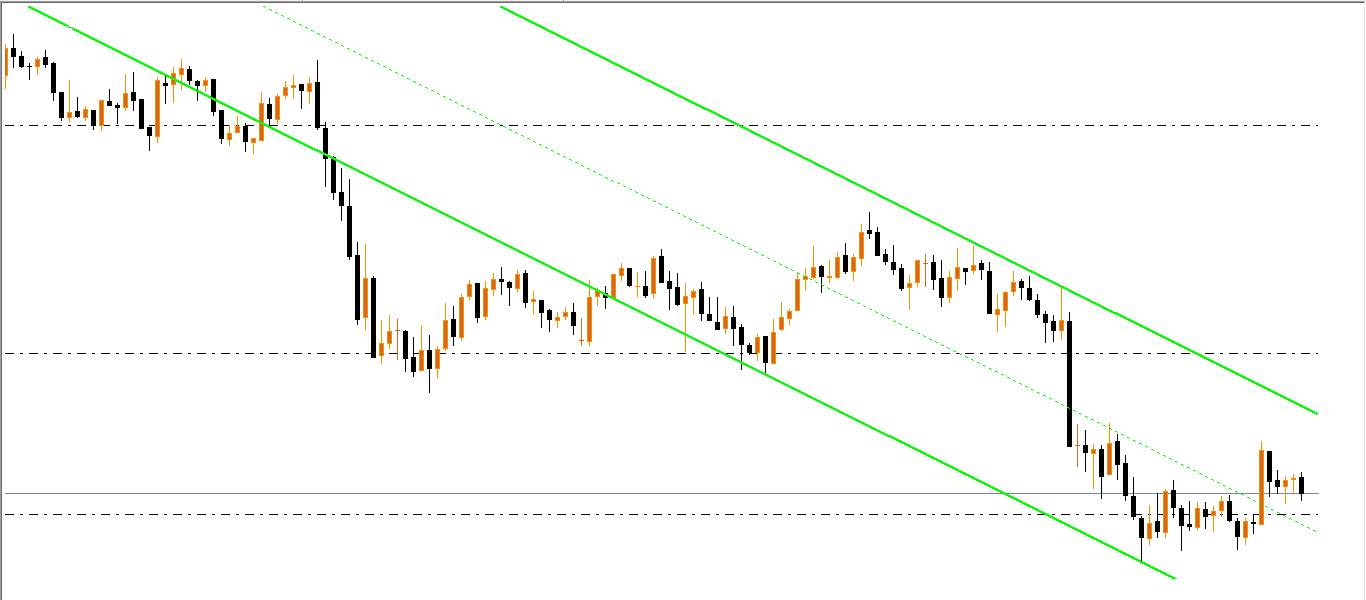
The chart example above shows the GBP/USD H4 timeframe, where the indicator dynamically adapts to price changes and clearly highlights the current trend direction.
Identify Trend Direction
When the channel slopes upward, it indicates a bullish trend.
When the channel slopes downward, it suggests a bearish trend.
A flat or sideways channel reflects consolidation or range-bound market conditions.
By analyzing the slope and angle of the channel, traders can determine the prevailing market direction at a glance.
Use the Middle Line as a Trend Guide
The middle dotted line serves as a trend reference.
Price action above the middle line generally indicates bullish strength.
Price below the middle line suggests bearish control.
Traders can use this line as a guide for entry timing and trade management.
Trade Breakouts and Reversals
Breakouts from the SHI Channel can signal a potential Trend Reversal or the start of a new momentum phase.
Buy Signal: When the price breaks above the upper channel line during an uptrend.
Sell Signal: When the price breaks below the lower channel line during a downtrend.
However, not all breakouts lead to sustainable trends. To minimize false signals, traders should combine this indicator with additional tools such as Moving Averages, ADX, or volume-based indicators for confirmation.
Tips for Trading With the SHI Channel True Indicator
Use it in conjunction with Support And Resistance levels or price action patterns.
Confirm breakouts using volume or momentum indicators.
Avoid taking trades during low volatility or sideways markets.
Best suited for swing trading and trend-following strategies on higher timeframes (H1, H4, Daily).
Why Use the SHI Channel True Indicator for MT4
Automatically identifies dynamic support and resistance zones.
Helps visualize trend direction and structure.
Detects breakout and reversal opportunities in real time.
Based on reliable fractal mathematics for precise channel placement.
Free to download and compatible with all MT4 trading instruments.
Conclusion
The SHI Channel True Indicator for MT4 is an excellent tool for traders seeking to identify trend direction, price channels, and potential breakout zones using a fractal-based approach. By plotting upper, lower, and middle channel lines, it visually represents key support and resistance levels.
When combined with other technical tools, such as momentum or volume indicators, the SHI Channel True Indicator becomes a valuable addition to any trader’s strategy toolkit. Download it for free and start using it today to improve your market analysis and trading accuracy.
FAQ
2 Downloads
Published:
Nov 09, 2025 04:35 AM
Category: