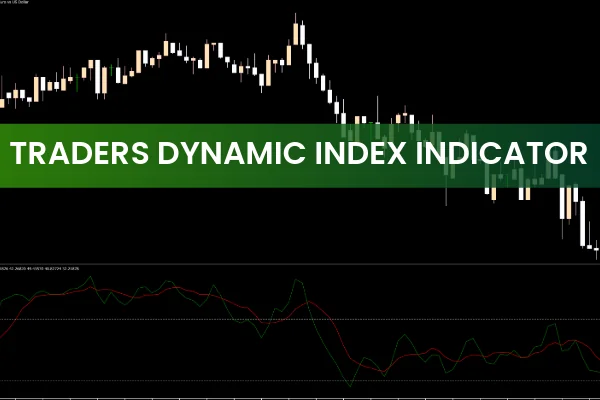
The Traders Dynamic Index (TDI) indicator for MT5 is one of the most respected and widely used technical analysis tools in forex trading. Designed from a combination of RSI, moving averages, and Bollinger Bands, this indicator provides a complete view of market strength, volatility, and potential trend reversals—all from a single window.
Because it blends multiple indicators into one, TDI gives clearer and more actionable signals compared to using RSI, MAs, or Bollinger Bands alone. This makes it a powerful tool for both beginners and professional traders looking for high-probability entry and exit points.
How the TDI Indicator for MT5 Works
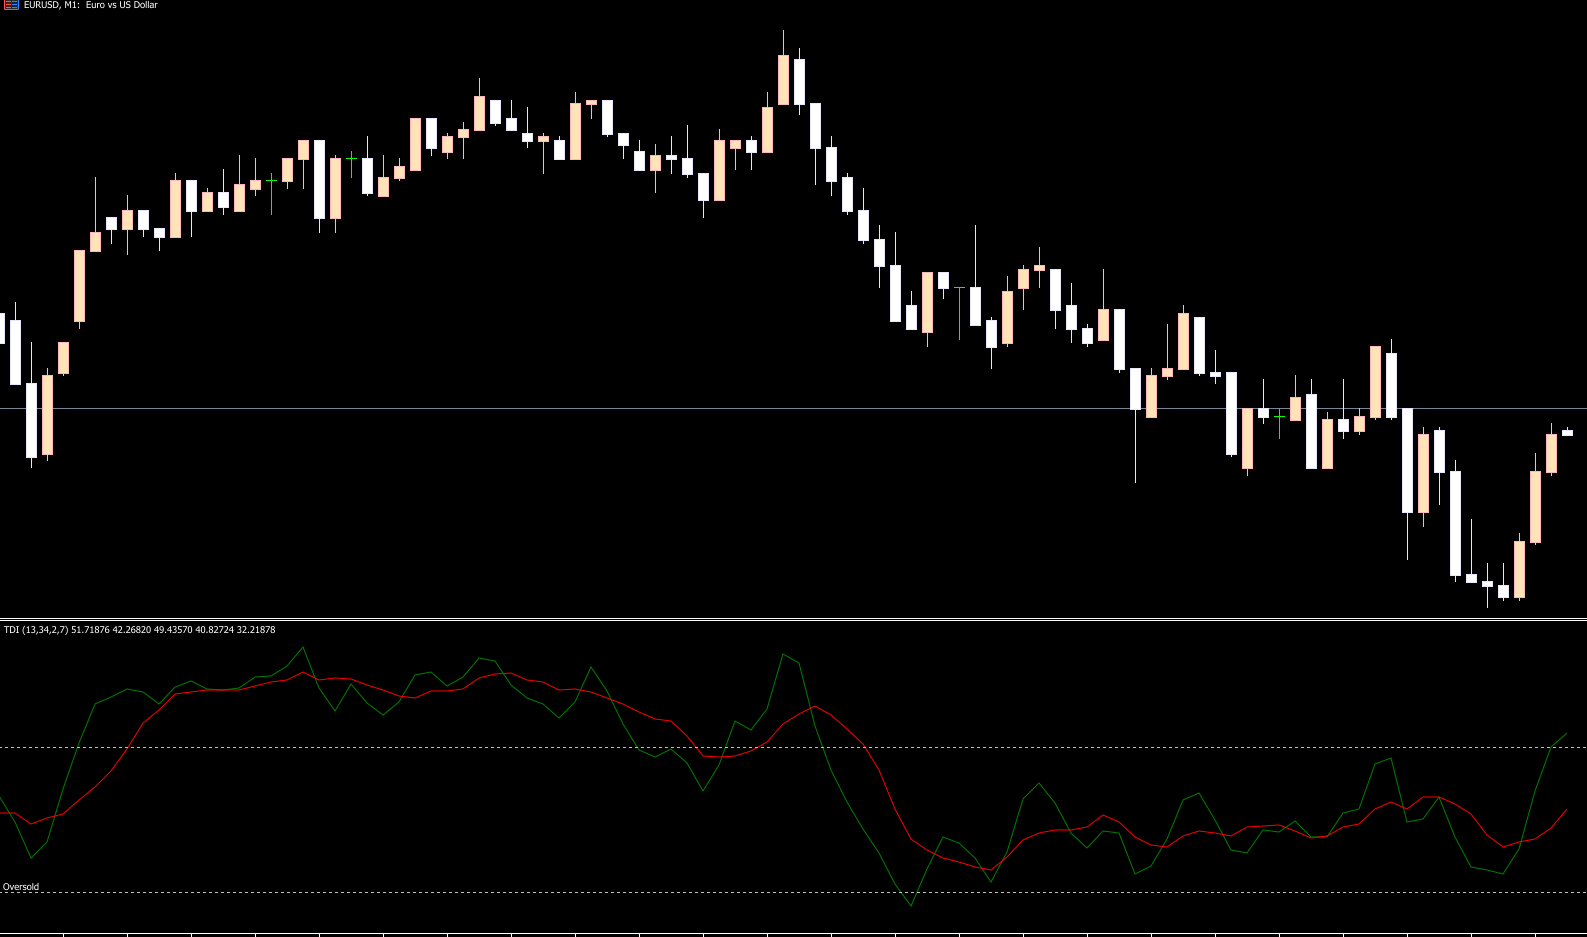
Once installed on MetaTrader 5, the TDI displays in a separate window below the price chart. Its key components include:
The Green Line (RSI Price Line – Fast Line)
This line reacts quickly to price movements.
It represents short-term momentum, helping traders identify immediate changes in market strength.
The Red Line (Signal Line – Slow Line)
Calculated using a longer period, the red line acts as a smoother trend guide.
When combined with the green line, it forms the basis for all trading signals.
Bollinger Bands (Blue Lines)
These can be enabled in the settings.
They show market volatility, expanding during high volatility and contracting during consolidation phases.
Market Base Line (Purple Line)
This central line helps determine the broader market bias—bullish or bearish.
Overbought & Oversold Zones
Above 68 = overbought
Below 32 = oversold
Crossings into these zones often warn of potential trend exhaustion.
With all these components working together, the TDI provides traders with a complete snapshot of price movement, volatility, and trend direction.
Traders Dynamic Index Trading Signals (MT5)
The EURUSD M30 chart example shows classic TDI trading signals in action.
Buy Signal
The green RSI line crosses above the red signal line
This indicates strengthening bullish momentum and suggests a buy opportunity.
Sell Signal
The red signal line crosses above the green line
This shows bearish pressure increasing, giving a sell signal.
Trend Reversal Signals
A cross inside the overbought or oversold regions (above 68 or below 32) often suggests the beginning of a reversal.
For example:
A bullish cross from oversold (below 32) → potential strong buy
A bearish cross from overbought (above 68) → potential strong sell
TDI Retreat Strategy (Take-Profit Method)
The retreat strategy helps traders take profit at logical points using TDI line reactions.
For Buy Trades
Take profit when:
Price reaches the next resistance zone
OR
The blue volatility band crosses below the green line, indicating weakening momentum
For Sell Trades
Take profit when:
Price reaches the next support level
OR
The green line crosses the red line downward, signaling bullish pressure returning
This method helps lock in profits before the market reverses.
Why the TDI Indicator Is So Effective
The Traders Dynamic Index works well because it merges the strengths of multiple indicators into one easy-to-read tool:
RSI → measures Trend Strength
Moving averages → smooth out noise and reveal direction
Bollinger Bands → expose volatility and breakout conditions
This combined approach gives traders more accurate buy/sell signals, clearer Market Structure, and better trend confirmation.
Additionally, TDI works on all major currency pairs and all timeframes, making it suitable for:
day trading
swing trading
Conclusion
The Traders Dynamic Index Indicator for MT5 provides everything a trader needs to identify market direction, trend strength, and reversal areas. With its combination of RSI, moving averages, and volatility bands, it delivers reliable BUY and SELL signals suitable for any trading style.
Forex traders can download and install the indicator easily, making it an excellent addition to any MT5 trading strategy. Whether you are a beginner or experienced trader, the TDI gives you the essential insight needed to trade confidently across different market conditions.
FAQ
6 Downloads
Published:
Nov 29, 2025 10:40 AM
Category: