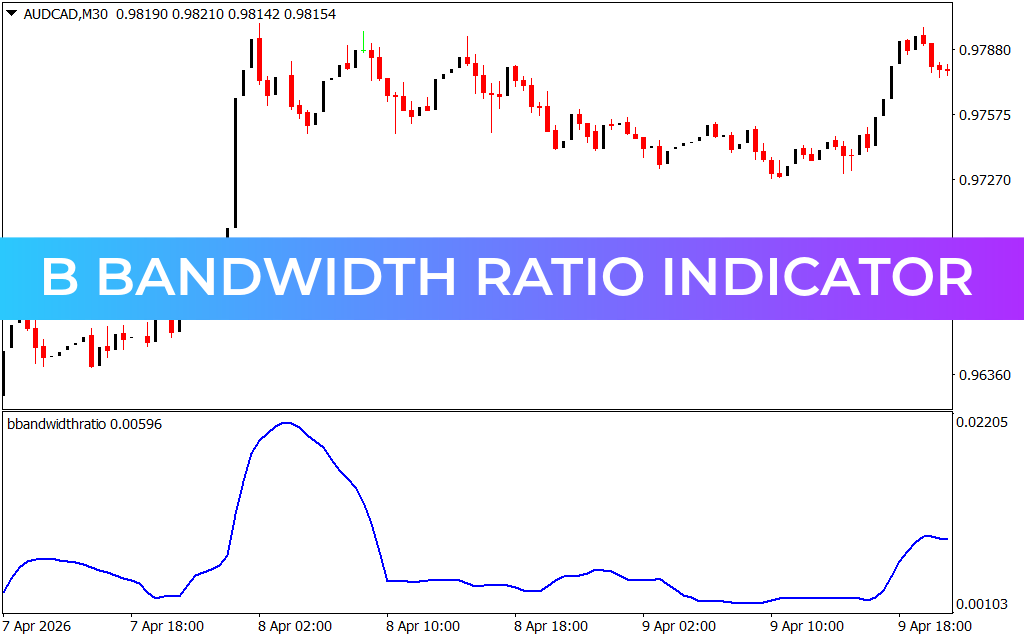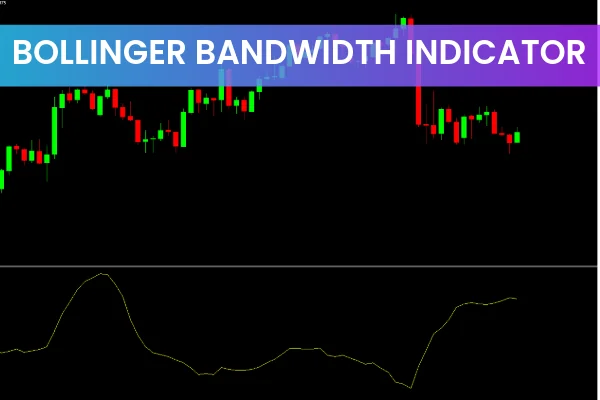
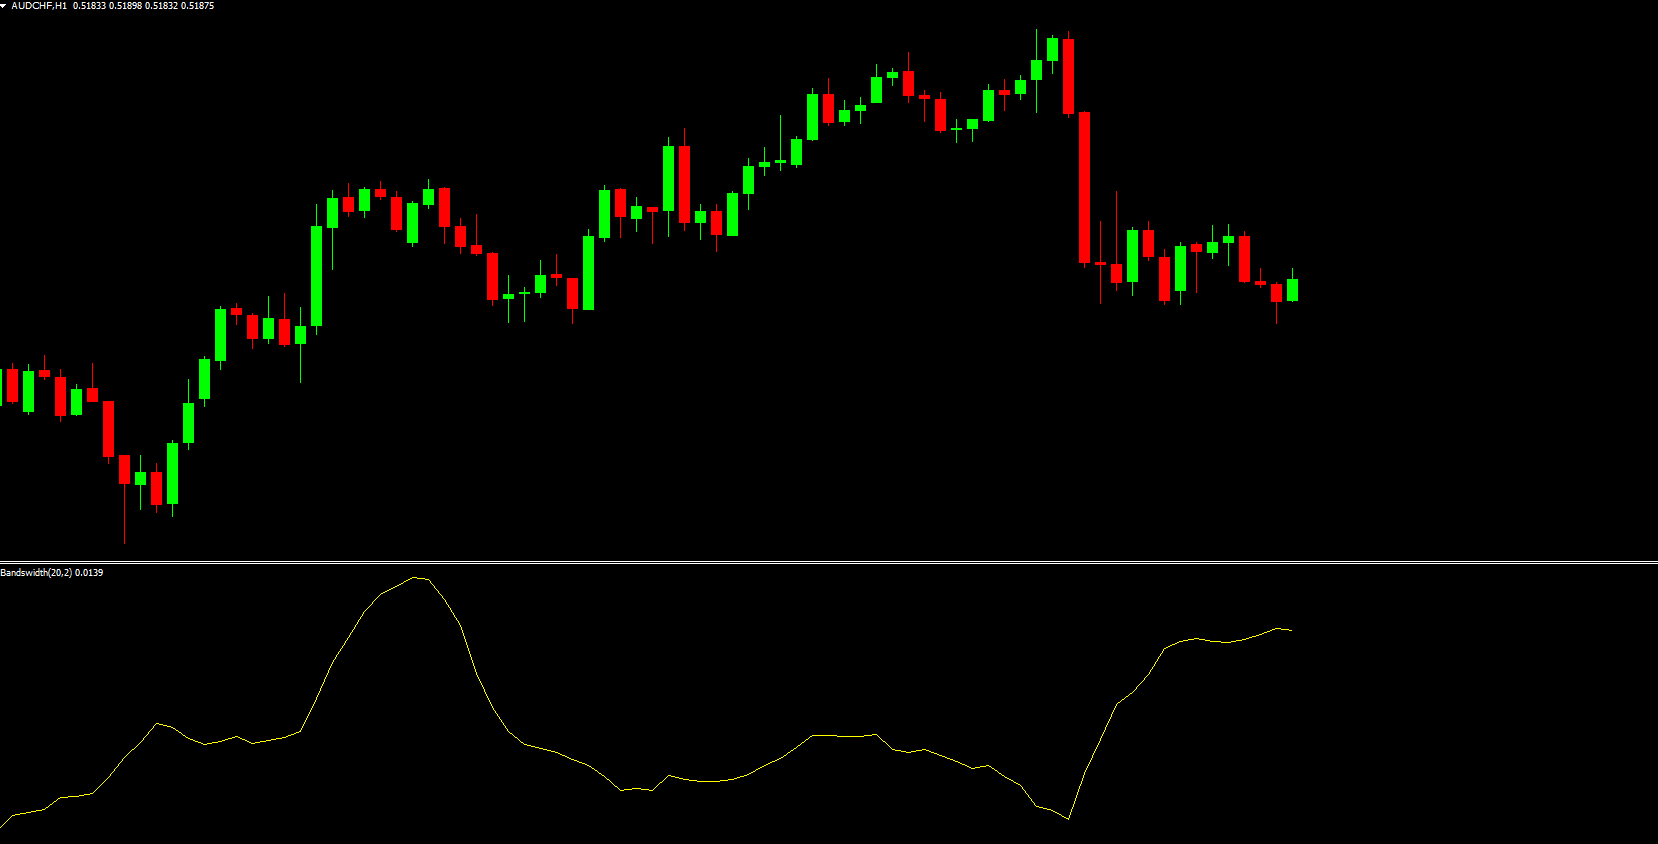
The Bollinger Bandwidth Indicator for MT4 is a technical tool that measures the width between the upper and lower bands of the classic Bollinger Bands indicator. By tracking the distance between these bands, traders can anticipate periods of high or low volatility, giving insight into potential upcoming price movements.
How the Bollinger Bandwidth Indicator Works
The indicator is typically plotted as an oscillator in a separate window. Its behavior is simple:
Increasing Bandwidth: Indicates rising volatility, often signaling strong price movements.
Decreasing Bandwidth: Signals low volatility, suggesting that the market may soon experience a breakout.
While the indicator does not indicate trend direction, it helps traders identify periods of market consolidation and expansion, allowing for better timing of trades.
Using the Bollinger Bandwidth Indicator for Trade Setups
Volatility Anticipation: Periods of low bandwidth often precede strong price moves. Traders can watch for contractions in the oscillator to anticipate market breakouts.
Double Tops and Bottoms: Identify reversal patterns in the oscillator. A double top may signal a sell opportunity, while a double bottom could indicate a buy opportunity.
Divergence Strategy: Look for divergence between the oscillator and price to anticipate potential moves. This can be combined with trendlines drawn on the oscillator for volatility insights.
Confirm with Price Action: Since the indicator does not provide trend direction, confirm trades using candlestick patterns, support/resistance levels, or other trend indicators.
The Bollinger Bandwidth Indicator works across all timeframes, making it suitable for intraday, swing, and longer-term trading. Beginners and advanced traders alike can use it to plan trades and manage risk effectively.
Benefits of the Bollinger Bandwidth Indicator
Measures market volatility accurately
Works in conjunction with the classic Bollinger Bands indicator
Suitable for all forex trading timeframes
Helps anticipate periods of high volatility for potential trading opportunities
Free to download and easy to install on MT4
Call to Action
Enhance your MT4 trading strategy with the Bollinger Bandwidth Indicator. Download it for free from IndicatorForest.com and start identifying periods of market volatility today.
FAQ
3 Downloads
Published:
Nov 21, 2025 00:33 AM
Category: