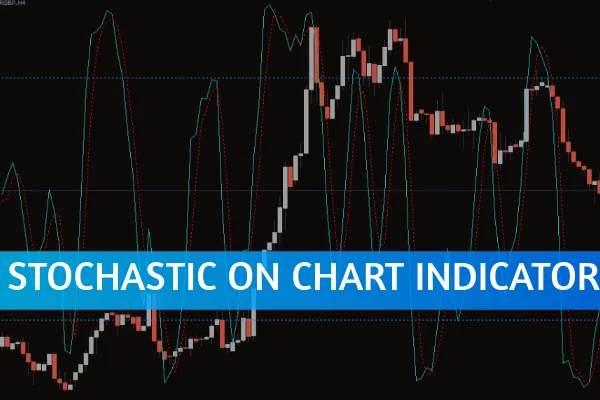
The Stochastic On Chart Indicator for MT4 offers a fresh and innovative way to interpret market momentum. Unlike the traditional stochastic oscillator that appears in a separate window, this indicator overlays the stochastic directly onto the price chart, providing traders with a real-time connection between momentum shifts and actual price movements. This feature-rich design gives traders a more intuitive understanding of market dynamics, helping to improve both entry and exit decisions in trading.
By merging price action analysis with momentum interpretation, the Stochastic On Chart Indicator helps traders refine their technical analysis strategies across various timeframes—whether you’re a day trader, scalper, or swing trader.
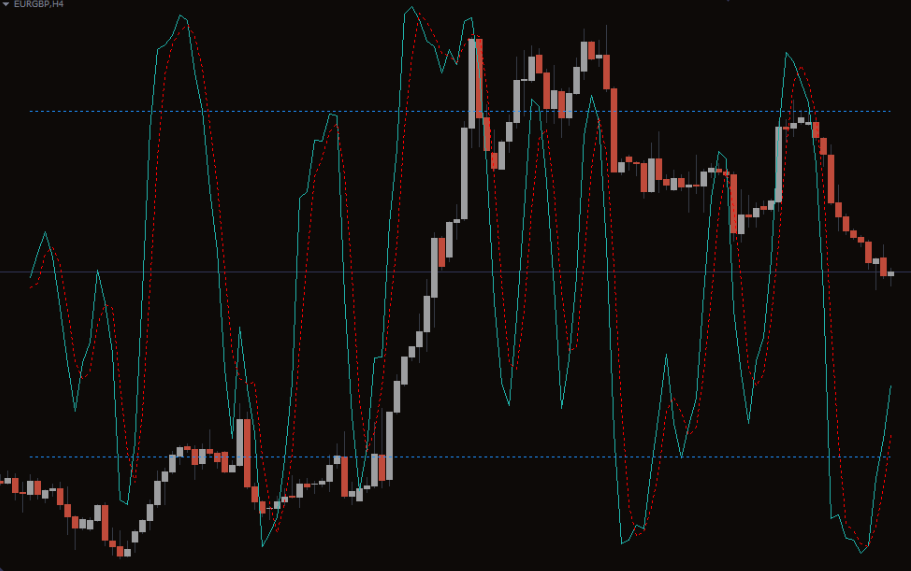
The Stochastic On Chart Indicator for MT4 is based on the popular stochastic oscillator, which measures the speed and momentum of price movements. However, instead of displaying its readings in a separate sub-window, this indicator projects the stochastic values directly over the candlestick chart.
This on-chart visualization allows traders to:
Instantly compare momentum strength against price direction.
Identify divergences between price and oscillator movements.
Spot potential reversals or trend continuation zones faster.
The indicator works effectively on all major forex pairs, commodities, and indices, making it a versatile addition to any MT4 setup.
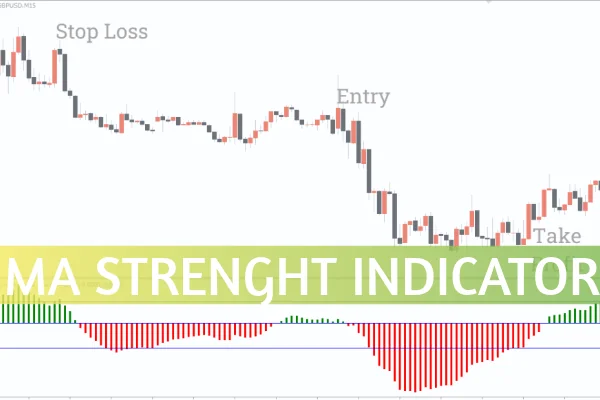
The indicator generates buy and sell signals using traditional stochastic logic but provides clearer context thanks to its integration with price data.
When the stochastic lines cross below the 20 level (oversold zone) and start to turn upward, it signals that buyers may be regaining control. This can indicate a good buying opportunity, especially if confirmed by bullish candlestick patterns on the chart.
When the stochastic lines cross above the 80 level (overbought zone) and begin turning downward, it suggests that sellers may be taking over, signaling a potential selling opportunity.
By observing these signals directly on the chart, traders can align momentum reversals with price action setups, reducing confusion and increasing precision in their trades.
Combining stochastic readings with price action helps traders see market structure and momentum together, allowing for quicker, more confident decisions.
Whether you’re analyzing a 1-minute scalping setup or a daily trend, this indicator adapts seamlessly across all MT4 chart timeframes.
By keeping both stochastic behavior and price patterns visible in one place, traders can spot false signals, divergences, and true momentum shifts more effectively.
The indicator allows users to adjust colors, levels, and smoothing parameters, making it adaptable to different trading systems and visual preferences.
Attach the Stochastic On Chart Indicator to your MT4 chart.
Set your preferred stochastic parameters (default: 14, 3, 3).
Watch for crossovers in the overbought/oversold zones.
Confirm signals with price action or support/resistance areas.
Use proper risk management and stop-loss placement to enhance trade safety.
The Stochastic On Chart Indicator for MT4 redefines how traders visualize momentum. By overlaying the stochastic oscillator directly on the price chart, it bridges the gap between momentum analysis and price movement, offering a clearer, more integrated trading experience.
If you want to elevate your technical analysis and spot high-probability trading opportunities, download this innovative indicator today at IndicatorForest.com.
Published:
Oct 29, 2025 14:23 PM
Category: