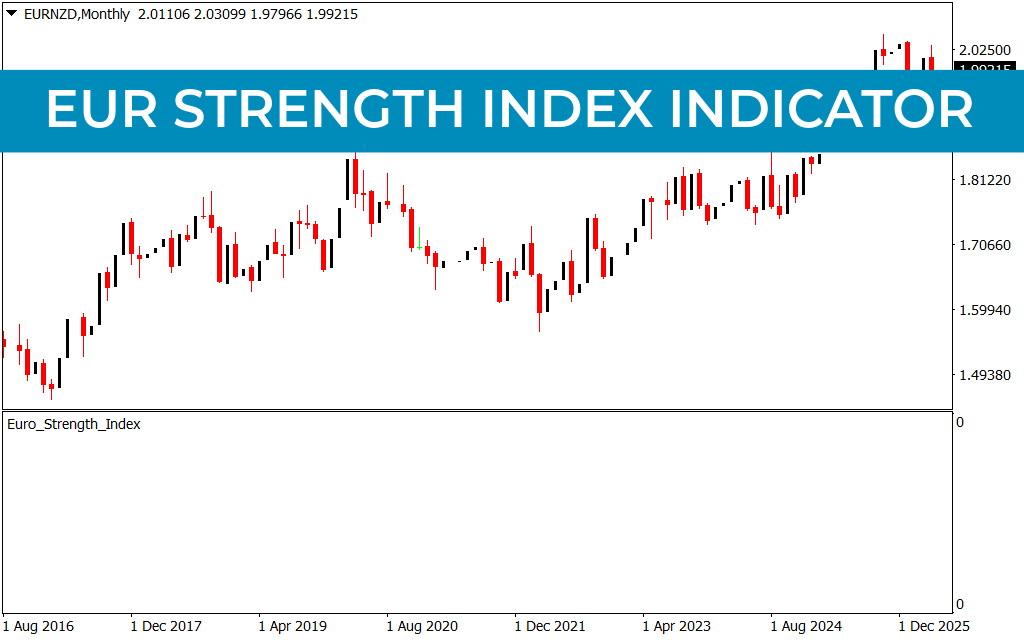
Mastering Market Breadth: A Guide to the STIX Indicator
In the pursuit of market mastery, traders often focus solely on price and time, neglecting the internal strength of a move. The STIX Indicator (Short-term Trading Index) is a powerful breadth oscillator designed to quantify the intensity of market participation. By analyzing the relationship between advancing and declining assets—or in the case of specific platform adaptations, the momentum of individual bars—the STIX provides a unique window into whether a trend is sustainable or nearing exhaustion.
What is the STIX Indicator?
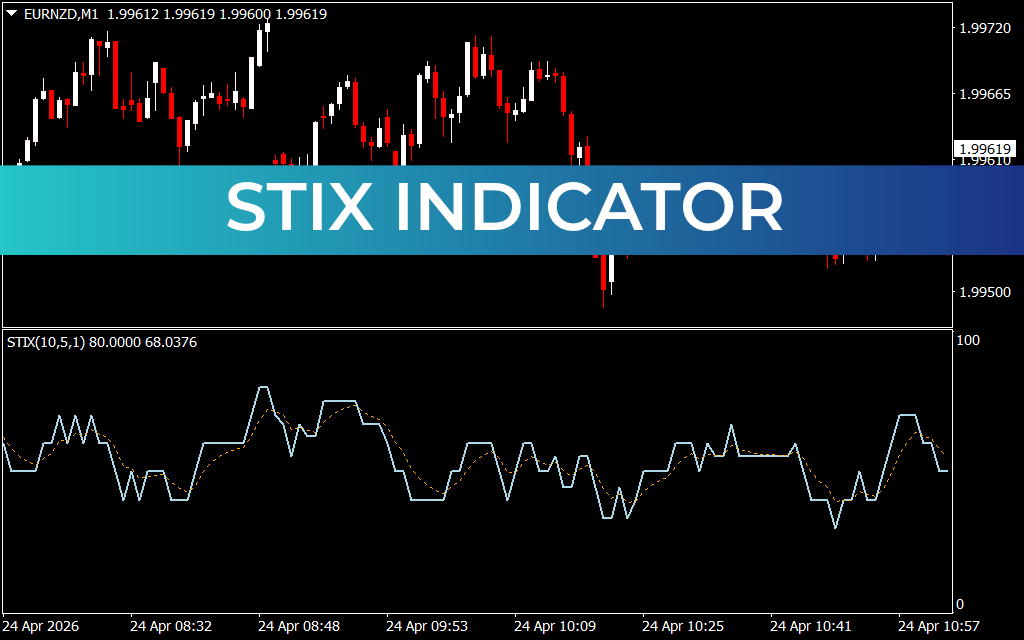
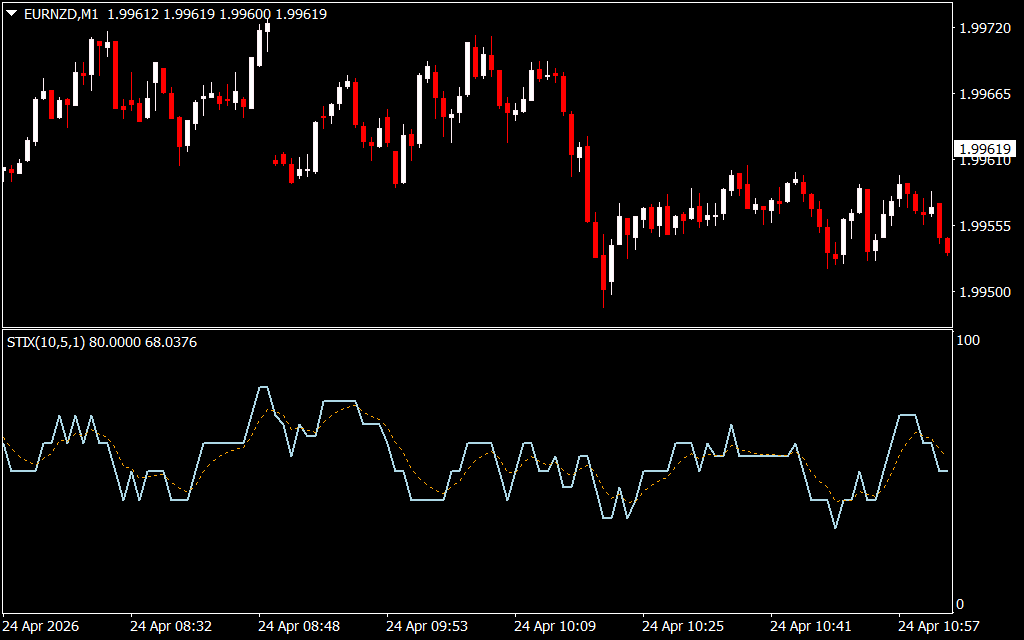
The STIX is a modified version of market breadth analysis, traditionally calculated using a moving average of the ratio between advancing and declining issues. On modern trading platforms like MetaTrader, the indicator is often adapted to measure short-term momentum cycles, appearing as an oscillator that moves between 0 and 100.
As seen in the EURNZD M1 chart, the STIX is represented by a jagged light blue line accompanied by a smoother, dashed signal line. This combination allows traders to see both the raw "pulse" of the market and the underlying trend of that momentum.
Key Benefits of Using STIX
- Overbought and Oversold Precision: The STIX is famous for its specific levels. Traditionally, a reading above 70 indicates an overbought market where a retracement is likely, while a reading below 30 suggests an oversold condition primed for a bounce.
- Momentum Smoothing: Unlike raw oscillators that can give erratic signals, the STIX applies an exponential smoothing process. This helps traders stay in trends longer by ignoring minor "noise" while focusing on the broader momentum shift.
- Leading Signal Capabilities: Because the STIX measures the internal pressure of a market, it often peaks or bottoms out before the price does. This "leading" characteristic gives proactive traders a head start on preparing for reversals.
- Volume-Price Confluence: While it is a momentum study, the STIX inherently reflects the "mass" of the market. Strong moves accompanied by high STIX readings are much more likely to continue than "hollow" moves with low participation.
Strategic Trading with STIX
To effectively trade with the STIX Indicator, one should look for Signal Line Crossovers. In the provided M1 chart, observe how the light blue STIX line frequently crosses its dashed signal line. When the STIX line hooks upward from a trough and crosses above the signal line, it confirms a bullish momentum shift, often preceding a recovery in Price Action.
Conversely, when the STIX line begins to plateau and cross below the signal line from an elevated level, it serves as a warning that the "fuel" for the current move is running low. For scalpers, these crossovers provide excellent entry and exit triggers. For swing traders, the STIX serves as a vital filter—helping you avoid entering a trade at the very end of a market cycle. By integrating this breadth-based approach into your technical analysis, you can trade with the confidence that the market's internal strength is supporting your position.
1 Download
Last Update:
Apr 24, 2026 15:30 PM
Published:
Feb 03, 2026 12:16 PM
Category: