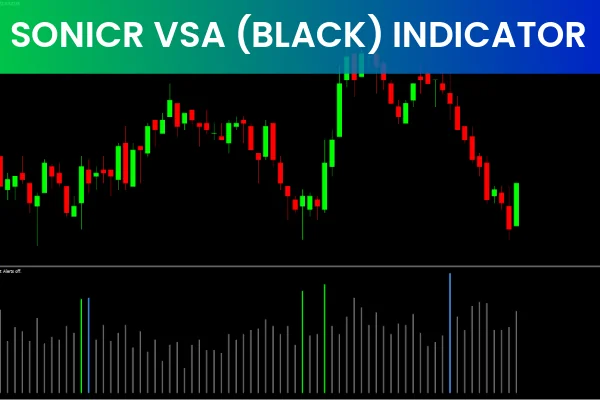
The SonicR VSA (Black) Indicator is a powerful volume spread analysis (VSA) tool built for MetaTrader. It evaluates the relationship between price spreads and trading volumes, helping traders identify the potential activity of major financial institutions. Because institutional participation affects both volume and spread behavior, the SonicR VSA (Black) Indicator provides insight into market sentiment, strength, and potential movement.
This indicator is especially useful for traders who want to understand whether price movement is supported by strong market participation or if it is weak and likely to reverse. By visualizing volume and spread behavior through color-coded histogram bars, the indicator acts as a guide for more informed entry, exit, and no-trade decisions.
Understanding the SonicR VSA (Black) Indicator
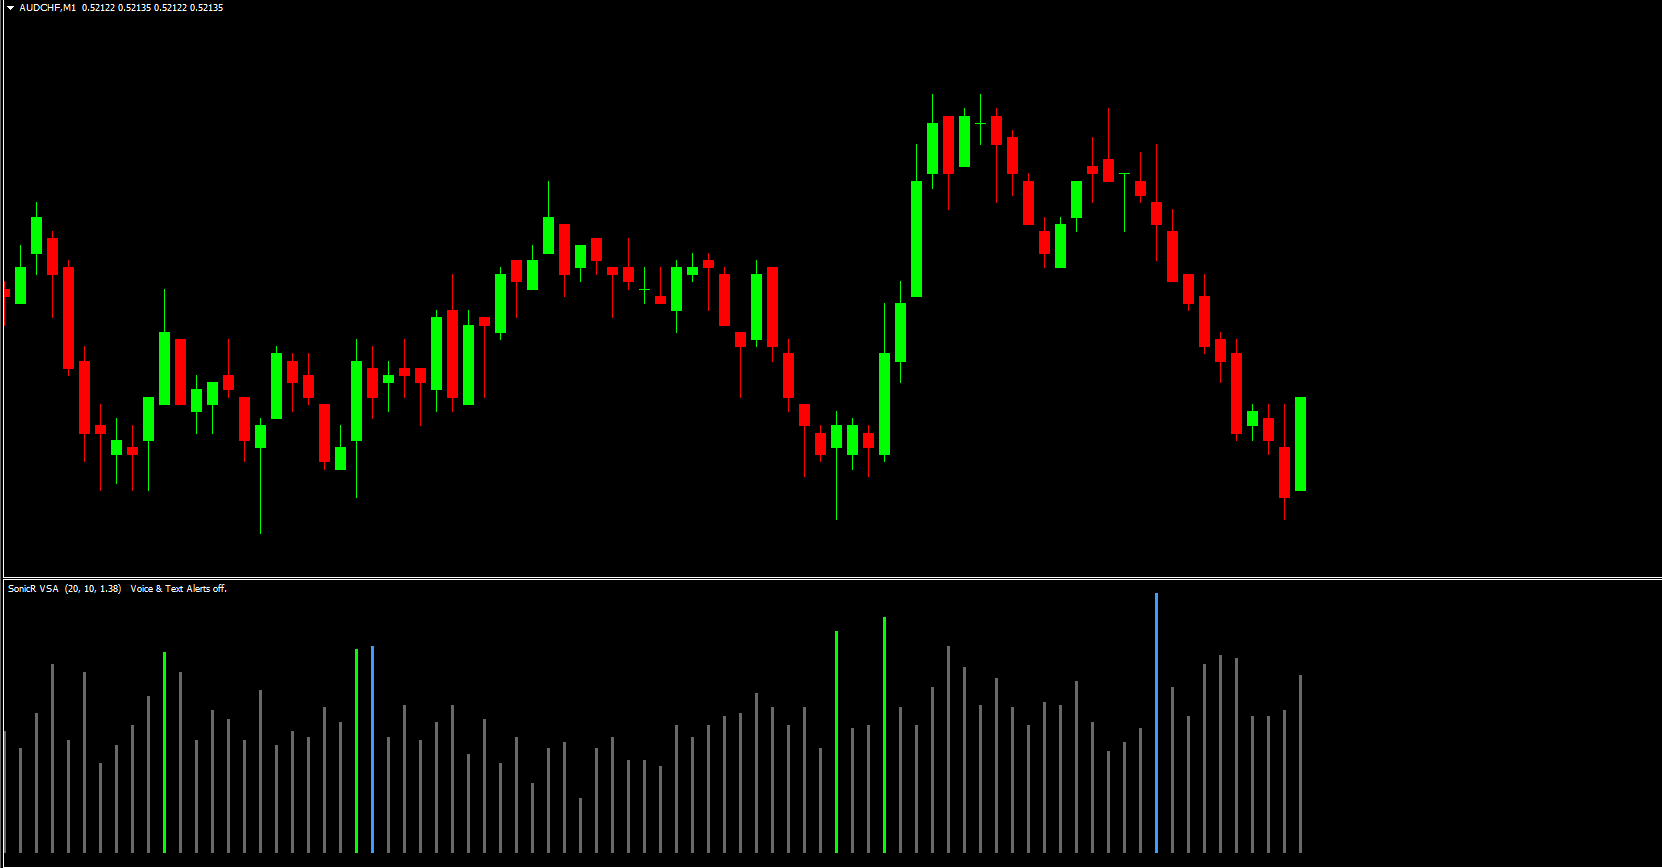
Volume Spread Analysis (VSA) measures how volume interacts with price spread. When large financial institutions—banks, hedge funds, liquidity providers—participate heavily in the market, their activity often creates changes in volume and candle spread. The SonicR VSA (Black) Indicator tracks these relationships and presents them clearly in a separate histogram panel on MT4.
The histogram bars display both the intensity of buying and selling pressure and the weakness or neutrality of the market. This helps traders understand when the price is moving with institutional support or when a move is likely unreliable.
How the SonicR VSA (Black) Indicator Works
The indicator displays multiple bar colors, and each color represents a different market condition:
Blue Bar
Indicates decreasing spread and increasing volume. This may suggest accumulation or preparation for a move, often signaling early institutional interest.
Lime Bar
Shows strong bullish volume. This is typically associated with professional buying activity or strong upward pressure driven by larger market participants.
Red Bar
Indicates strong bearish volume. This often represents professional selling, distribution, or aggressive bearish pressure.
Dim Gray Bar
Represents a neutral state with no strong buying or selling pressure. Markets often consolidate during these periods.
These VSA signals allow traders to understand whether market behavior is genuine, manipulated, or likely to lack follow-through.
Does the SonicR VSA (Black) Indicator Generate Buy/Sell Signals?
It is important to note that the SonicR VSA (Black) Indicator does not produce direct buy or sell arrows. Instead, it provides context. Traders must interpret volume and spread data alongside Price Action.
The indicator is best used as a confirmation tool, rather than a standalone signal generator. For example:
A lime bar appearing during a pullback in an uptrend may confirm bullish continuation.
A red bar forming at resistance may validate bearish pressure or institutional selling.
Blue bars may highlight early preparation for a breakout or breakdown.
This approach helps filter out false signals that often occur in low-volume or erratic markets.
Ideal Trading Styles for the SonicR VSA Indicator
One of the strengths of the SonicR VSA (Black) Indicator is its flexibility. It suits various trading styles, including:
Scalping: Identifying short, high-volume bursts
Intraday/Day trading: Recognizing institutional momentum
Swing trading: Confirming Trend Continuation or reversal zones
Both beginners and experienced traders can use it effectively since it does not clutter the main chart and works well with other technical tools.
Tips for Using SonicR VSA (Black) Effectively
To maximize accuracy, combine volume spread analysis with:
Trend direction
Candle patterns like pin bars and engulfing candles
Market Structure (higher highs/lows, breakouts, pullbacks)
Avoid entering trades solely on a color change. Instead, view the indicator as a market sentiment analyzer.
Conclusion
The SonicR VSA (Black) Indicator for MT4 is one of the most effective tools for understanding volume and spread relationships in the forex market. It provides valuable insights into institutional participation, helping traders refine entries, exits, and risk management. Because it does not interfere with candlesticks and remains easy to interpret, it is suitable for traders at all experience levels. Best of all, the indicator is free to download.
For more high-quality MT4 indicators and trading tools, visit IndicatorForest.com.
FAQ
2 Downloads
Published:
Nov 23, 2025 11:24 AM
Category: