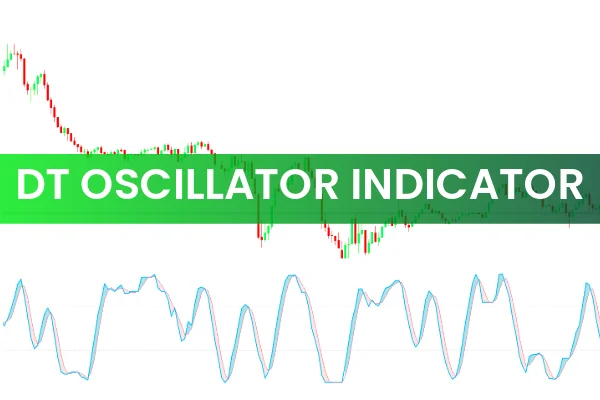
The DT Oscillator Indicator for MT5 is a hybrid technical analysis tool that merges the Relative Strength Index (RSI) and Stochastic Oscillator to determine market momentum and potential reversals. Designed for both new and experienced traders, this indicator helps identify overbought and oversold conditions, making it a valuable addition to any trading strategy.
Like other oscillators, the DT Oscillator fluctuates between 0 and 100—where 0 indicates an oversold condition and 100 represents an overbought state. Traders use these levels to spot potential turning points in market trends.
Although the indicator performs well across all timeframes, it tends to deliver more accurate signals on higher timeframes such as H4 or Daily, where market noise is significantly reduced.
How the DT Oscillator Indicator Works
The DT Oscillator MT5 calculates signals by combining two key momentum indicators:
RSI (Relative Strength Index): Measures the strength and velocity of recent price movements to identify overbought or oversold conditions.
Stochastic Oscillator: Compares a closing price to its price range over a specific period, providing insight into potential trend reversals.
By merging these two indicators, the DT Oscillator provides a smoother and more responsive representation of market momentum, minimizing false signals while maintaining sensitivity to real price shifts.
How to Use the DT Oscillator Indicator for MT5
To generate trading signals using the DT Oscillator, traders should focus on how the indicator behaves near the extreme levels (0 and 100):
Buy Signal (Bullish Reversal):
When the indicator approaches or touches 0, it indicates an oversold condition. This means the market may soon reverse upward, signaling a potential buy opportunity.
Sell Signal (Bearish Reversal):
When the indicator nears or touches 100, it suggests the market is overbought and may experience a downward reversal, signaling a potential sell opportunity.
However, traders should note that not every approach to these levels results in a reversal. To avoid false entries, you can use the standard RSI or Stochastic indicator as confirmation tools.
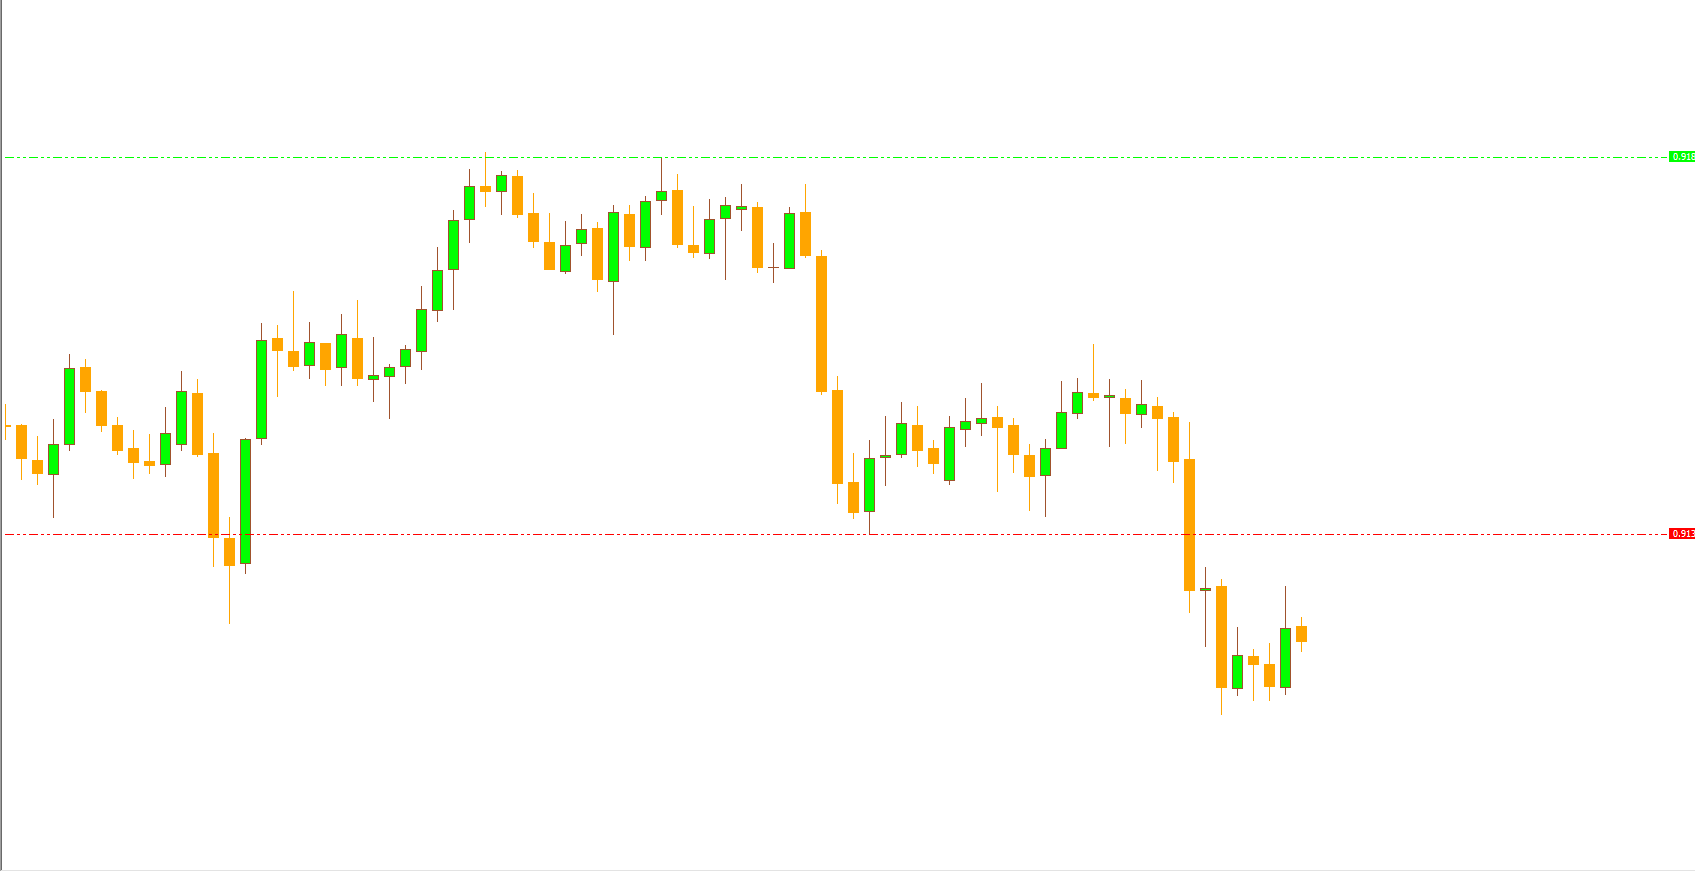
Example of DT Oscillator in Action
On the AUDNZD H1 chart, the DT Oscillator can be observed generating signals near the key levels:
When the oscillator touched 0, the market entered an oversold zone, leading to a bullish rebound.
When the oscillator reached 100, a bearish reversal occurred shortly after.
For improved accuracy, traders can also confirm these signals with Candlestick Patterns such as bullish engulfing or bearish pin bars to validate the oscillator readings.
Advantages of Using the DT Oscillator Indicator for MT5
Dual Analysis: Combines RSI and Stochastic for more reliable signals.
Accurate Reversal Detection: Identifies key overbought and oversold zones.
Multi-Timeframe Compatibility: Works on all timeframes and currency pairs.
Noise Reduction: Performs better on higher timeframes for cleaner analysis.
Free and Easy to Use: Available at IndicatorForest.com.
Conclusion
The DT Oscillator Indicator MT5 is an effective trend and Momentum Indicator that merges RSI and Stochastic calculations to help traders identify overbought and oversold market conditions.
It provides clear BUY and SELL signals and works across all markets and timeframes, making it a flexible choice for forex traders. For optimal results, combine it with other confirmation tools like RSI, MACD, or Price Action analysis.
To download the DT Oscillator Indicator for MT5 and explore more free trading tools, visit IndicatorForest.com.
FAQ
1 Download
Published:
Nov 09, 2025 09:11 AM
Category: