Optimize Your Entries with the Double Stochastic RSI Multicolor Filtered 2.0
In the high-velocity world of technical analysis, traders are constantly searching for the "holy grail" of indicators: a tool that is sensitive enough to catch early moves but filtered enough to avoid false signals. The Double Stochastic RSI Multicolor Filtered 2.0 for MetaTrader is a sophisticated answer to this challenge. By combining the momentum-tracking power of the Relative Strength Index (RSI) with the cyclical sensitivity of the Stochastic oscillator—and then doubling the calculation process—this indicator provides a remarkably smooth and actionable view of market momentum.
The Evolution of the Oscillator
Standard oscillators often struggle in trending markets, frequently becoming "pinned" at extreme levels and leading traders to exit profitable positions too early. The Double Stochastic RSI 2.0 addresses this by applying a second layer of Stochastic smoothing to the RSI data. This "double" processing eliminates much of the jagged noise found in traditional indicators, resulting in a cleaner line that more accurately reflects the underlying price trend.
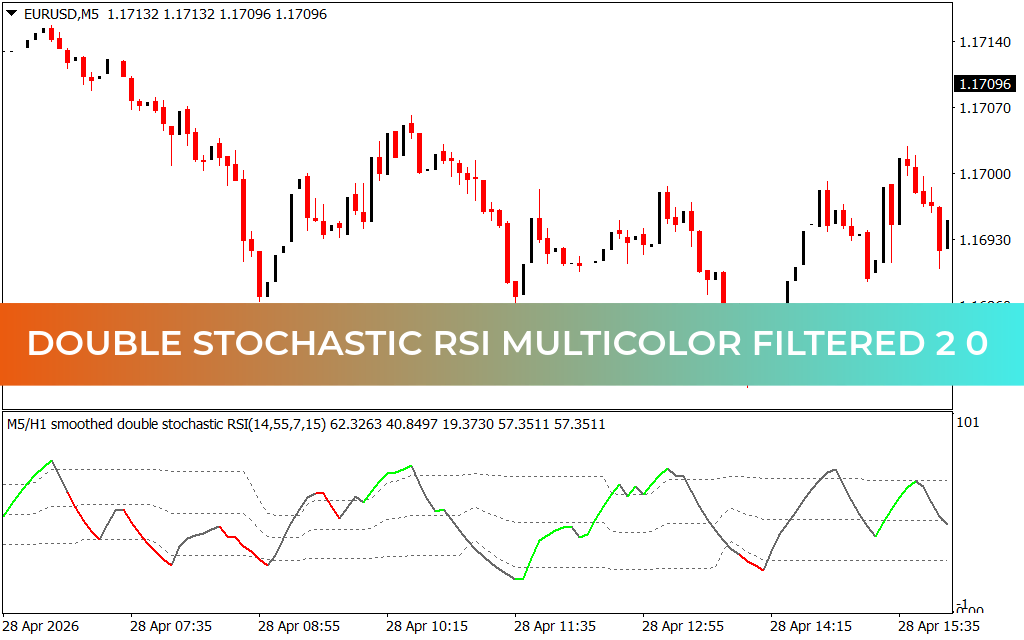
As shown in the EUR/USD M5 chart, the indicator features a dynamic multicolor interface:
- Green Momentum: Indicates a strong bullish phase where the price is accelerating upward. This serves as a "go" signal for long entries or a reason to hold existing buy positions.
- Red Momentum: Signals a bearish acceleration. When the line turns red, it warns of increasing selling pressure and potential short opportunities.
- Gray/Neutral Zones: These areas represent periods of consolidation or waning momentum, advising traders to exercise caution before the next directional expansion.
Advanced Filtering and Overbought/Oversold Logic
What sets the Multicolor Filtered 2.0 version apart is its advanced internal filtering. Unlike basic oscillators that oscillate purely between 0 and 100, this version uses smoothed double-stochastic math to identify "true" overbought and oversold conditions.
Traders can utilize the dotted horizontal levels as trigger zones. A reversal from the oversold floor (typically the 20 level) accompanied by a color change to green provides a high-probability entry point. Conversely, a rejection from the overbought ceiling (the 80 level) with a color shift to red indicates that the current buying wave is exhausted.
Strategic Versatility for Scalpers and Swing Traders
While exceptionally popular on lower timeframes like the M1 and M5 for Scalping, the Double Stochastic RSI Multicolor Filtered 2.0 is equally effective for swing trading on the H1 and H4 charts. Its ability to filter out "market noise" makes it an excellent companion for trend-following systems. By only taking buy signals when the higher-timeframe trend is bullish, traders can significantly increase their win rate.
Whether you are navigating the intraday volatility of the Forex majors or tracking long-term shifts in commodities, this indicator provides the visual clarity required for disciplined execution. It transforms complex momentum data into a simple, color-coded roadmap, allowing you to trade with the confidence of a professional who has a mathematically superior edge.
1 Download
Last Update:
Apr 29, 2026 02:02 AM
Published:
Jan 31, 2026 15:53 PM
Category: