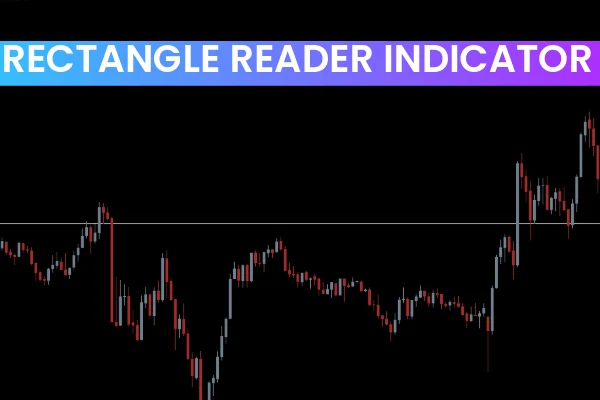
The Rectangle Reader Indicator for MT4 is an essential tool for Forex traders who use supply and demand zones in their trading strategies. By automatically extending manually plotted rectangles on higher timeframes, the indicator allows traders to visualize these zones on lower timeframes, improving the accuracy of trade entries and exits.
This indicator is particularly useful for traders who want to combine higher timeframe market context with lower timeframe execution, reducing risk and enhancing profitability. Whether you are a novice or an experienced trader, the Rectangle Reader Indicator provides clear visual cues for spotting potential trend reversals or breakout setups.
How the Rectangle Reader Indicator Works
The indicator requires a manually plotted rectangle that represents a supply or demand zone. Once the rectangle is drawn on a higher timeframe (H4, Daily, or Weekly), the indicator performs the following:
Extends Trend Lines: The upper and lower boundaries of the rectangle are projected a few candles to the right, providing a clear visual of the zone’s range.
Multi-Timeframe Visibility: The rectangle and trend lines are displayed on lower timeframes, allowing traders to spot entry points without switching charts.
Automatic Updates: As new candles form, the rectangle and trend lines are automatically redrawn to remain accurate, maintaining alignment with market structure.
This dynamic plotting ensures traders always know where key Supply And Demand zones are located, even when working on shorter timeframes.
Trading Strategy Using Rectangle Reader Indicator
The Rectangle Reader Indicator supports several trading approaches:
Breakout Trades
Enter a trade when the price breaks above the upper trend line of a demand zone (buy) or below the lower trend line of a supply zone (sell).
The breakout indicates strong momentum in the direction of the price movement.
Breakout Failure / Reversal Trades
Sometimes, the price touches the rectangle trend line but fails to break it.
Traders can enter trades in the opposite direction when the price rejects the zone, indicating that supply or demand is still strong.
Higher-Lower Timeframe Strategy
By combining higher timeframe rectangles with lower timeframe chart entries, traders reduce risk exposure while finding more precise entry points.
This multi-timeframe alignment enhances trading confidence and improves win rates.
Benefits of Using Rectangle Reader MT4
Multi-Timeframe Awareness: Visualize H4, Daily, or Weekly zones on lower charts.
Dynamic Extension: Rectangles automatically extend to cover new candles.
Improved Trade Accuracy: Helps identify breakouts, retests, and reversals in supply/demand zones.
User-Friendly: Simple manual rectangle plotting starts the indicator’s automatic functions.
Suitable for All Levels: Works well for beginners and advanced traders alike.
Conclusion
The Rectangle Reader Indicator for MT4 is a powerful companion for traders focused on supply and demand strategies. By projecting higher timeframe zones onto lower timeframes, the indicator helps spot profitable trade opportunities while minimizing risk. With automatic updates and clear visualization, it enhances market awareness and decision-making for Forex traders.
Download the Rectangle Reader MT4 indicator for free from IndicatorForest.com and start improving your supply and demand trading today.
FAQ
8 Downloads
Published:
Nov 13, 2025 23:14 PM
Category: