Master Multi-Timeframe Strategy with the Bollinger Bands MTF Indicator
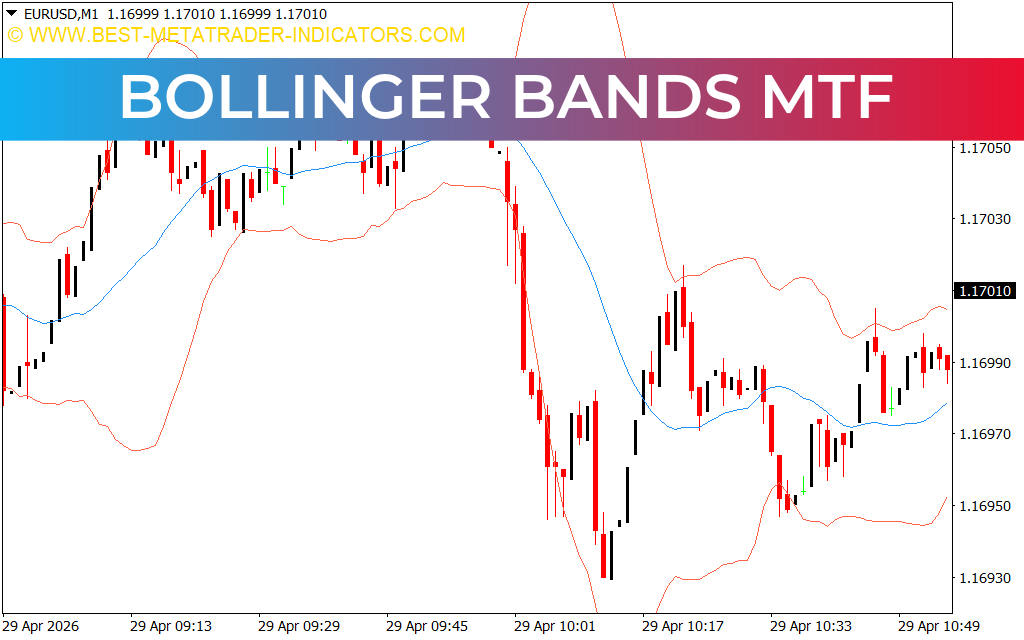
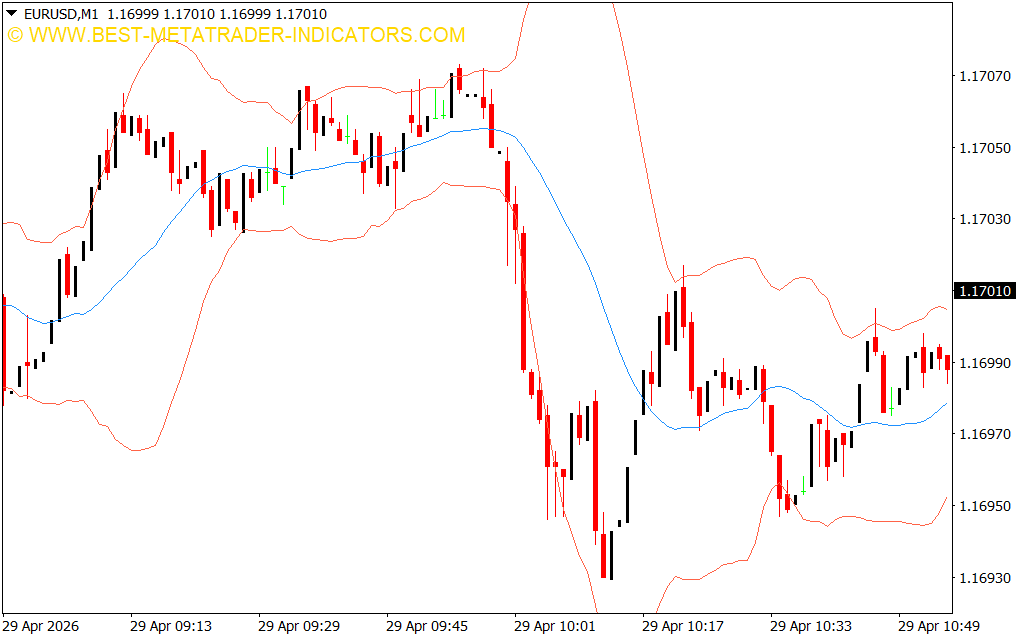
In technical analysis, the ability to see the "big picture" without leaving your current chart is a significant competitive advantage. While standard Bollinger Bands are a staple for measuring volatility and identifying overbought or oversold conditions, they are limited to the timeframe currently displayed. The Bollinger Bands MTF (Multi-Timeframe) indicator breaks this barrier, allowing traders to overlay higher-timeframe volatility channels directly onto their intraday charts.
What is the Bollinger Bands MTF Indicator?
Bollinger Bands consist of a middle moving average and two outer bands calculated based on standard deviation. They expand during high volatility and contract during low volatility. The MTF version of this tool enables you to plot, for example, H1 (1-hour) or H4 (4-hour) Bollinger Bands on an M1 (1-minute) or M15 (15-minute) chart.
This creates a "nested" view of Market Structure. By seeing where the current price sits relative to higher-timeframe boundaries, you can filter out low-probability signals and align your trades with the dominant market force.
Why Multi-Timeframe Analysis is Essential
Trading in a vacuum is a common mistake for beginners. A "buy" signal on a 1-minute chart might actually be a collision with a major 1-hour resistance band.
- Institutional Context: Higher timeframes represent the zones where institutional players—banks and hedge funds—typically place their orders.
- Dynamic Support And Resistance: When a lower-timeframe Price Action touches a higher-timeframe Bollinger Band, the probability of a strong rejection or a massive breakout increases exponentially.
- Trend Filtering: If the H4 Bollinger Bands are sloping upward, a trader might choose to only take "long" setups on the M15 chart, using the MTF bands as a guide.
Strategic Trading Applications
Integrating the Bollinger Bands MTF into your MetaTrader setup provides several high-level strategies:
- The MTF Rebound: On an M15 chart, look for the price to touch an outer band of the H1 Bollinger Bands. If the price shows rejection (such as a pin bar), it signals a high-probability mean-reversion trade back toward the H1 median.
- Volatility Squeeze Across Eras: When both the current timeframe and the higher-timeframe bands contract simultaneously, it indicates a "mega-squeeze." The resulting breakout is often one of the most powerful moves in the market.
- Trend Riding: Use the higher-timeframe middle line (the SMA) as a dynamic trailing stop. As long as price remains on one side of the H4 median, the long-term trend remains intact.
Conclusion
The Bollinger Bands MTF indicator is a must-have for traders who prioritize structural awareness. By bridging the gap between short-term execution and long-term context, it provides a 360-degree view of market volatility. Whether you are a scalper looking for major hurdles or a swing trader seeking precise entries, this tool offers the multi-dimensional perspective required to excel in today's complex financial environment.
10 Downloads
Last Update:
Apr 29, 2026 15:43 PM
Published:
Jan 31, 2026 00:54 AM
Category: