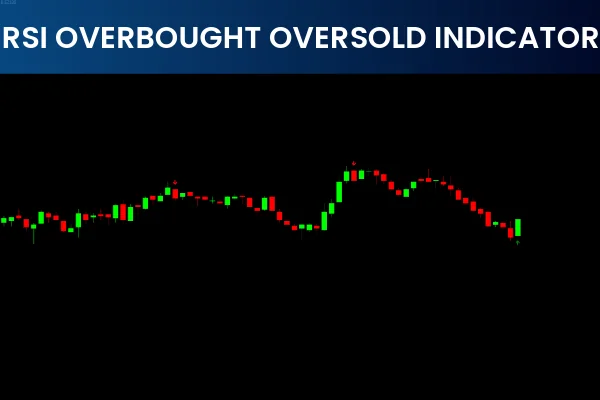
The RSI Overbought Oversold Indicator is a powerful momentum-based tool that generates highly probable buy and sell signals when market conditions align with Price Action. It uses a unique configuration of the Relative Strength Index (RSI) to identify upcoming price movements and detect moments when the market is overvalued or undervalued. Traders use this enhanced RSI tool to capture trend reversals, measure momentum strength, and anticipate pullbacks in both forex and stock markets.
Understanding How the RSI Indicator Works
The Relative Strength Index evaluates the speed and amplitude of recent price changes. Traditionally, RSI values above 70 indicate overbought conditions, while values below 30 signal oversold markets. The RSI Overbought Oversold Indicator takes this concept further by adding visual arrow alerts at potential turning points.
Unlike basic RSI tools, this version incorporates price-action filters that help identify correction phases, trend exhaustion, and possible market reversals. This provides traders with clearer insight into when a trend is slowing or preparing to shift direction.
Why Use the RSI Overbought Oversold Indicator?
This indicator offers several advantages:
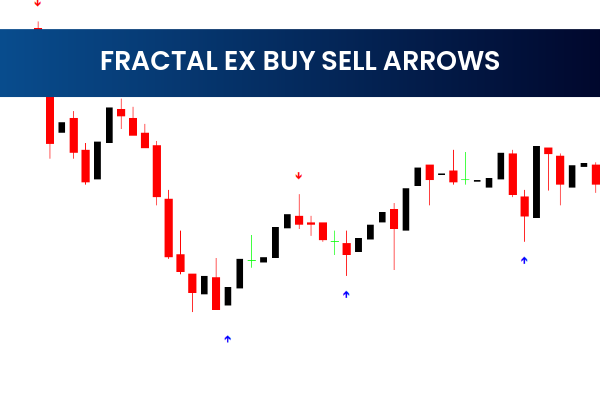
Visual arrow-based reversal alerts
Early detection of Trend Strength and weakness
Identification of market exhaustion zones
Filtering of pullbacks and continuation patterns
Ability to trade multiple timeframes in MT4
Because it reacts smoothly to market momentum, it is ideal for traders who prefer clean, rule-based entries without relying heavily on subjective chart analysis.
How to Trade Using the RSI Overbought Oversold Indicator for MT4
The indicator prints an arrow whenever price reverses from a critical market high or low. These arrows mark potential reversal points, but traders should always confirm signals using basic price action principles.
Confirming a Bullish RSI Signal
A bullish arrow appears when price rejects a recent low or oversold zone. Before entering a buy trade, consider:
Is the price forming a higher low?
Is the market approaching support or a demand zone?
Is momentum increasing after a pullback in an uptrend?
For example, if the price rejoins an existing uptrend while forming a higher low, the bullish arrow can serve as a strong buy confirmation.
Confirming a Bearish RSI Signal
A bearish arrow appears when price fails to break a resistance or reaches an overbought level.
Consider the following scenario:
On an hourly GBP/USD chart, price initially fails to move above the resistance at 1.2143. After testing this resistance again, the market forms a bearish pin bar. At the same time, the RSI Overbought Oversold Indicator plots a downward arrow above the bearish candle. This alignment between a resistance rejection and a momentum signal produces a reliable sell opportunity.
Trading in Choppy Markets: What to Watch Out For
Like most momentum indicators, RSI can deliver inconsistent signals in sideways or low-volatility environments. Here are ways to filter noisy signals:
Identify the major trend using higher timeframes
Use RSI arrows only near key levels (support, resistance, supply/demand)
Avoid signals during consolidation or ranging markets
Confirm entries using candlestick patterns (pin bars, engulfing candles, inside bars)
By applying these filters, traders significantly improve the reliability of RSI-based setups.
Best Practices for Using the RSI Overbought Oversold Indicator
To get the best results from this MT4 tool, consider the following guidelines:
Combine signals with fixed horizontal levels or dynamic zones such as moving averages
Look for confluence between RSI arrows and price-action structures
Prioritize trades in the direction of the dominant trend
Use stop-loss orders below structural lows for buys and above structural highs for sells
Backtest various settings across different currency pairs and timeframes
Conclusion
The RSI Overbought Oversold Indicator goes far beyond pointing out overbought and oversold markets. It provides actionable insights into pullbacks, momentum shifts, and potential trend reversals. When combined with support/resistance levels and price-action confirmation, this indicator becomes a reliable component of a disciplined trading strategy.
For more powerful MT4 indicators and trading tools, visit IndicatorForest.com.
FAQ
1 Download
Published:
Nov 23, 2025 10:28 AM
Category: