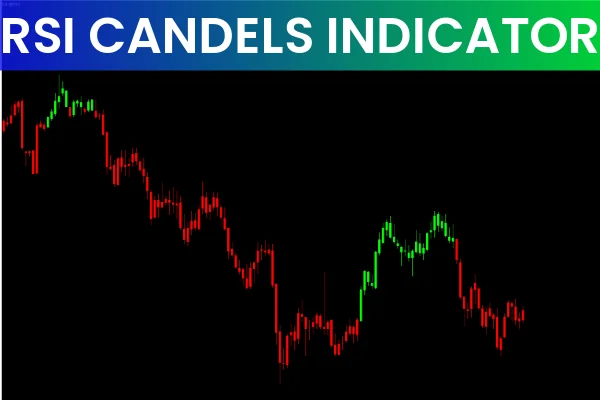
The RSI Candles Indicator for MT4 is a unique trading tool that automates the display of Relative Strength Index (RSI) values directly on candlesticks. Unlike the traditional RSI indicator, which is plotted in a separate window, this tool shows bullish and bearish sentiment visually on the price chart itself.
Designed specifically to highlight trend direction, the RSI Candles indicator simplifies decision-making for traders by color-coding each candlestick according to its RSI value. It is particularly useful for identifying ongoing bullish or bearish trends without cluttering the chart with extra indicator windows.
How the RSI Candles Indicator Works
The RSI Candles Indicator operates around the 50.00 RSI level, which acts as the threshold between bullish and bearish trends:
RSI > 50.00 → bullish sentiment → candlestick turns lime green
RSI < 50.00 → bearish sentiment → candlestick turns red
This method allows traders to quickly identify the market trend at a glance.
How to Read RSI Candles
Observe the color of each candlestick:
Lime green → price momentum is bullish
Red → price momentum is bearish
Identify trend continuity by monitoring consecutive candlesticks of the same color.
Combine with support/resistance levels, Price Action patterns, or other indicators like moving averages to improve signal accuracy.
Trading With RSI Candles Indicator
Bullish Trend (Buy)
When candlesticks turn lime green and stay above the 50.00 RSI level.
Confirm with price action or other technical indicators.
Enter long positions when momentum is sustained and supported by Market Structure.
Bearish Trend (Sell)
When candlesticks turn red and RSI stays below 50.00.
Use price action confirmations such as bearish engulfing patterns or resistance rejection.
Open short positions during a confirmed downtrend.
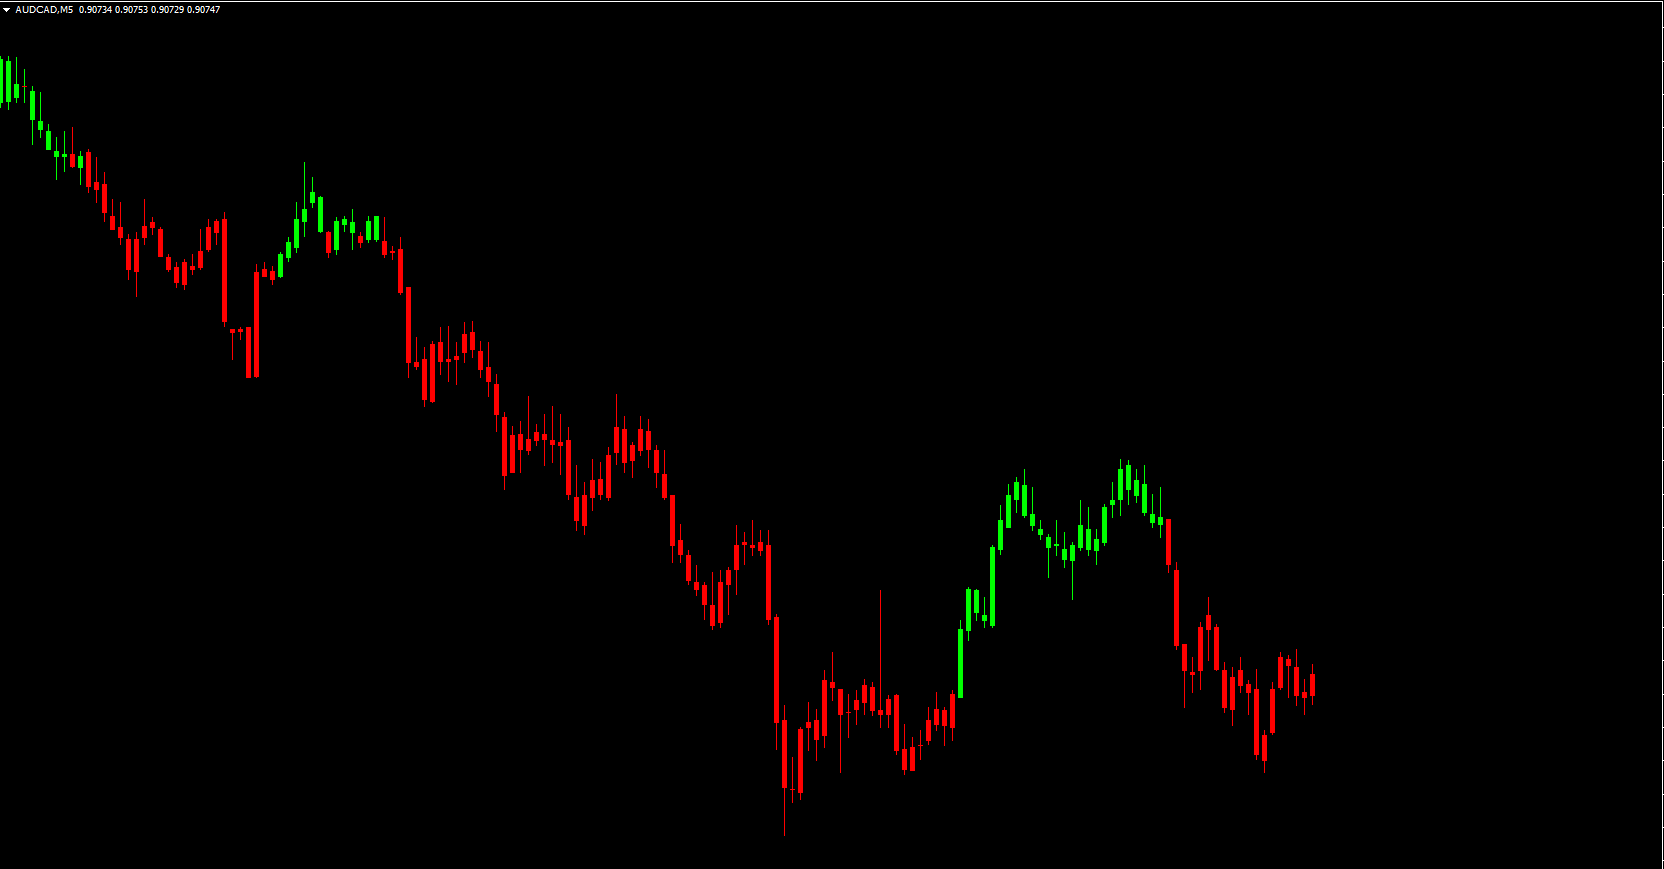
Example
On a EUR/USD H1 chart, the RSI Candles indicator clearly displays trend sentiment:
Continuous red candles below the 50.00 level signal a strong bearish trend.
Traders can use this to identify selling opportunities while confirming with price action or trend oscillators.
This visual approach eliminates the need to constantly reference an RSI window, allowing faster and more intuitive trade decisions.
Tips for Using the RSI Candles Indicator
Best used as a trend confirmation tool, not a stand-alone entry/exit indicator.
Combine with support/resistance levels, moving averages, or MACD for higher accuracy.
Works effectively on lower and mid-range timeframes (M5, M15, H1).
Ideal for Forex, indices, and commodities with clear trend structures.
Conclusion
The RSI Candles Indicator for MT4 is a practical tool for traders who want a clear visual representation of bullish and bearish market sentiment. By directly coloring candlesticks based on RSI values, it allows quick trend analysis and improves trading efficiency. For better results, always combine it with other technical tools such as price action or trend oscillators.
Discover more advanced MT4 indicators and trading strategies at IndicatorForest.com to enhance your Forex and intraday trading performance.
FAQ
19 Downloads
Published:
Nov 19, 2025 04:38 AM
Category: