Master Market Reversals with the Curves Arrows Indicator
In the competitive world of Forex trading, identifying the exact moment a trend exhausts itself is the "holy grail" of technical analysis. Many traders rely on standard bands or channels, but these often lack the specific trigger points needed for precise execution. The Curves Arrows indicator bridges this gap by combining dynamic price envelopes with an intelligent signal overlay, designed to highlight high-probability reversal zones.
What is the Curves Arrows Indicator?
The Curves Arrows indicator is a sophisticated volatility-based tool that plots a two-line green channel directly onto the price chart. This channel acts as a flexible boundary, adjusting in real-time to market volatility and price fluctuations. Unlike static Support And Resistance lines, these "curves" expand and contract based on market momentum.
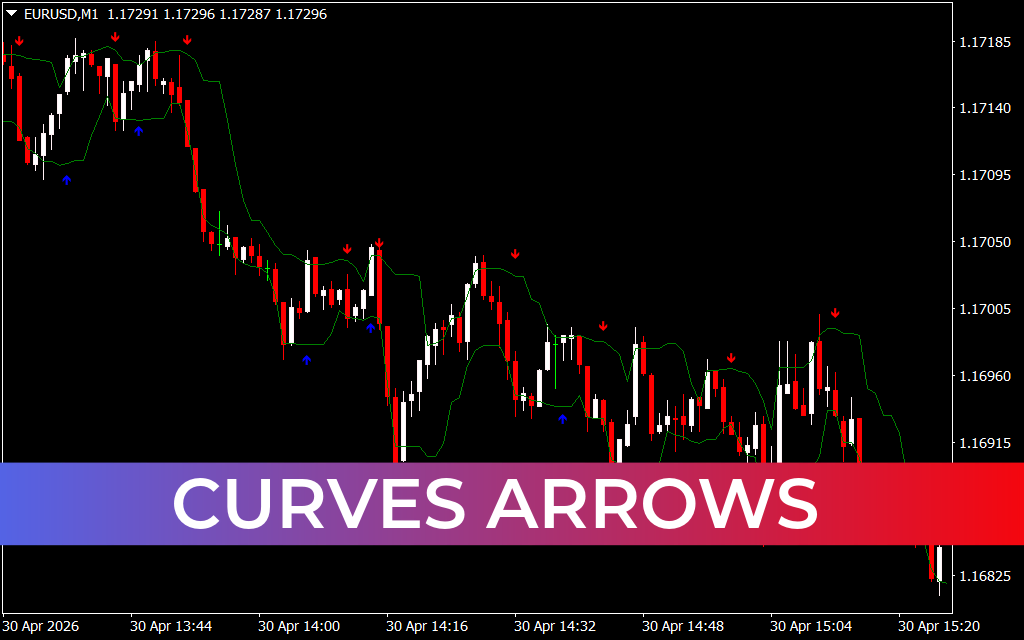
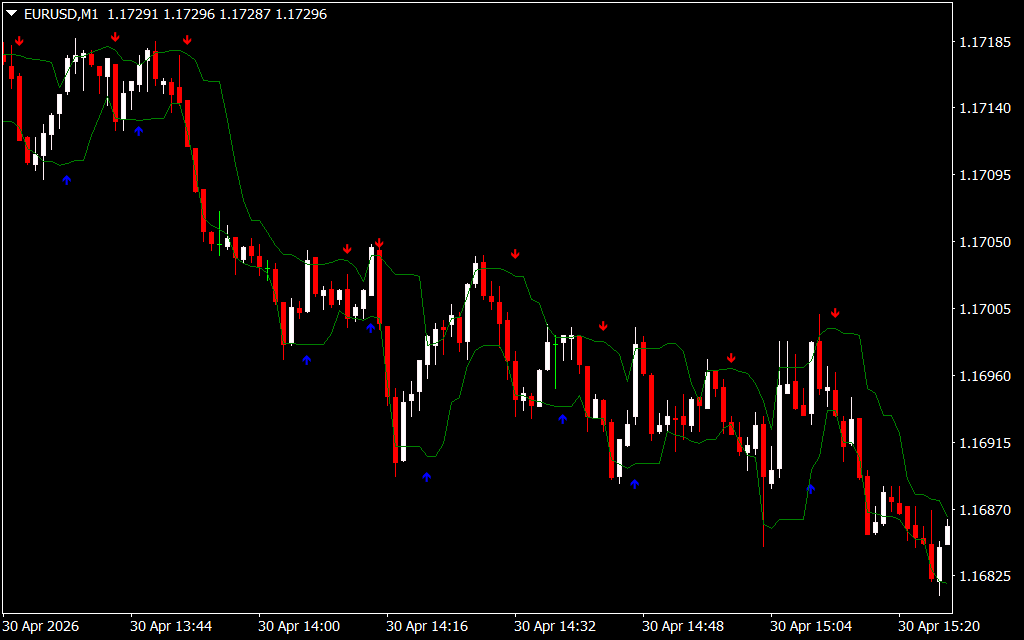
The core strength of this tool lies in its integrated signal logic. As seen in the provided image, the indicator automatically plots visual cues when price interacts with the channel boundaries:
- Red Downward Arrows: Appear at the upper curve, signaling that price is overextended to the upside and a bearish reversal or "sell" opportunity is likely.
- Blue Upward Arrows: Appear at the lower curve, indicating that the market is oversold and a bullish bounce or "buy" entry is imminent.
Key Features and Benefits
- Dynamic Volatility Envelopes: The green channel lines act as moving targets for Price Action, helping traders visualize the current "fair value" range and identifying extreme deviations.
- Instant Signal Recognition: By translating complex interaction logic into simple red and blue arrows, the indicator significantly reduces the cognitive load on the trader, allowing for faster decision-making.
- Versatile Timeframe Performance: While the M1 chart in the example highlights its effectiveness for scalpers, the Curves Arrows algorithm remains robust on higher timeframes like H1 or H4 for swing traders.
- Non-Repainting Accuracy: Designed for the MetaTrader 4 platform, this indicator focuses on providing stable signals that help traders maintain discipline and avoid chasing late entries.
Strategic Trading with Curves Arrows
To maximize the win rate of the Curves Arrows indicator, it is most effective when used as part of a confluence-based strategy.
- Trend Alignment: In a strong downtrend, prioritize the red sell arrows that appear at the upper channel. In an uptrend, focus on the blue buy arrows at the lower boundary to join the trend on a pullback.
- Candlestick Confirmation: When a red or blue arrow appears, look for accompanying Candlestick Patterns—such as pin bars or engulfing candles—to confirm the reversal sentiment before entering the trade.
- Exit Management: The opposite channel line serves as an ideal primary take-profit target. For example, if you enter a buy trade on a blue arrow, consider closing the position when price reaches or pierces the upper green curve.
Conclusion
The Curves Arrows indicator is a powerful addition to any technical analyst’s toolkit. By providing a clear visual representation of market boundaries and automated entry triggers, it removes the guesswork from mean-reversion trading. Whether you are looking to refine your Scalping entries or improve your swing trade timing, the Curves Arrows tool provides the clarity and precision needed to navigate today's volatile markets with confidence.
5 Downloads
Last Update:
Apr 30, 2026 23:22 PM
Published:
Jan 30, 2026 18:40 PM
Category: