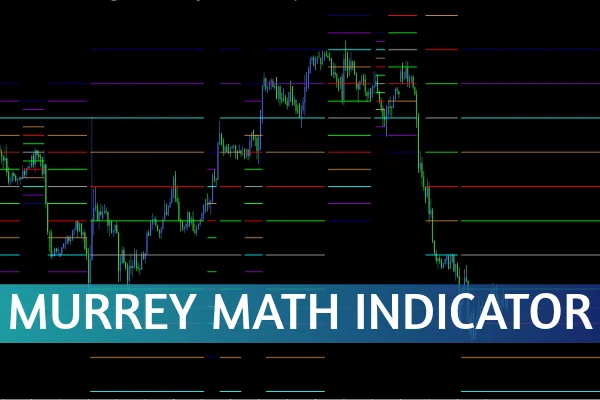
The Murrey Math Indicator is a powerful technical analysis tool designed to identify hidden Support And Resistance areas in the market. By using pivot lines, it divides Price Action into eight key levels that act as buy, sell, and exit points. Traders often rely on these lines to determine high-probability trading zones and make informed decisions.

Unlike standard support and resistance tools, the Murrey Math Indicator applies a mathematical framework that adapts to market volatility. Each line represents a price reaction level—some act as strong barriers, while others serve as zones where price movement accelerates.
How the Murrey Math Lines Work
The indicator draws eight primary lines, ranging from 0/8p to 8/8p, each serving a specific role in defining the Market Structure. Let’s break down their significance:
0/8 and 8/8 Lines – The strongest support and resistance levels. Price rarely breaks through these zones.
2/8 and 6/8 Lines – Known as powerful reversal points; excellent for detecting trend changes.
3/8 and 5/8 Lines – Represent the top and bottom of the average trading range. The price often consolidates between these levels.
4/8 Line – The central pivot line, offering the highest probability trade setups. A close above or below 4/8 often signals the start of a new trend.
These levels not only act as barriers but also serve as price magnets, pulling the market toward equilibrium.
Trading Strategies Using the Murrey Math Indicator
Many traders use the Murrey Math lines as part of their support and resistance trading strategies. Here are some practical tips:
Trading the 4/8 Pivot Line:
When the price closes above the 4/8 line, it often signals bullish strength—consider entering a long trade. Conversely, a close below the 4/8 line may indicate bearish pressure.
Combining with Other Indicators:
The Murrey Math Indicator performs best when used alongside momentum tools like the Relative Strength Index (RSI) or Moving Average Convergence Divergence (MACD). This combination helps confirm trend reversals and filter false signals.
Identifying Reversal Zones:
Watch how the price reacts around 2/8, 4/8, and 6/8 levels. These zones are historically strong turning points, ideal for buying low and selling high.
Murrey Math Line X Example
Let’s look at an example involving the EUR/GBP currency pair. The chart demonstrates how the price reverses at the 4/8 and 3/8 lines, which serve as major resistance areas. The 4/8 line acts as the resistance for the overall trend, while 3/8 defines resistance for short-term price swings. Similarly, the 1/8 and 2/8 lines serve as minor pivot levels where temporary reversals occur.
By observing these reactions, traders can anticipate market turns and plan entries or exits with greater confidence.
Why Use the Murrey Math Indicator?
Precision: It divides price movement into mathematically defined zones.
Flexibility: Works across various timeframes and asset classes.
Simplicity: Once mastered, the visual clarity helps traders make faster decisions.
Compatibility: Can be combined with Fibonacci retracements or trend indicators for additional confirmation.
Overall, the Murrey Math Indicator simplifies market structure analysis, making it suitable for both beginners and advanced traders.
Conclusion and Call-to-Action
The Murrey Math Indicator is an essential tool for identifying support and resistance zones, offering clear trade entry and exit signals. By understanding how each line functions—from 0/8p to 8/8p—you can trade with improved accuracy and confidence.
To download the Murrey Math Indicator or explore more powerful trading tools, visit IndicatorForest.com and enhance your trading strategy today.
1 Download
Published:
Oct 31, 2025 02:30 AM
Category: