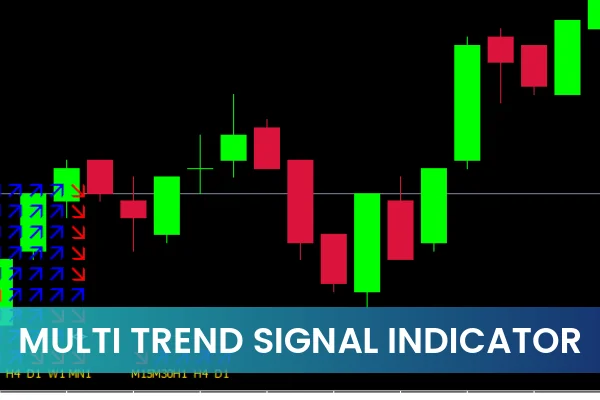
The Multi Trend Signal Indicator for MT4 is a powerful trading tool designed to identify market trends using the combined signals of nine popular technical indicators. These include ADX, RSI, MOM, CCI, OsMA, MACD, SAR, WPR, and Moving Average (MA). Each of these indicators analyzes different aspects of the market, helping traders confirm the direction of the trend with greater confidence.
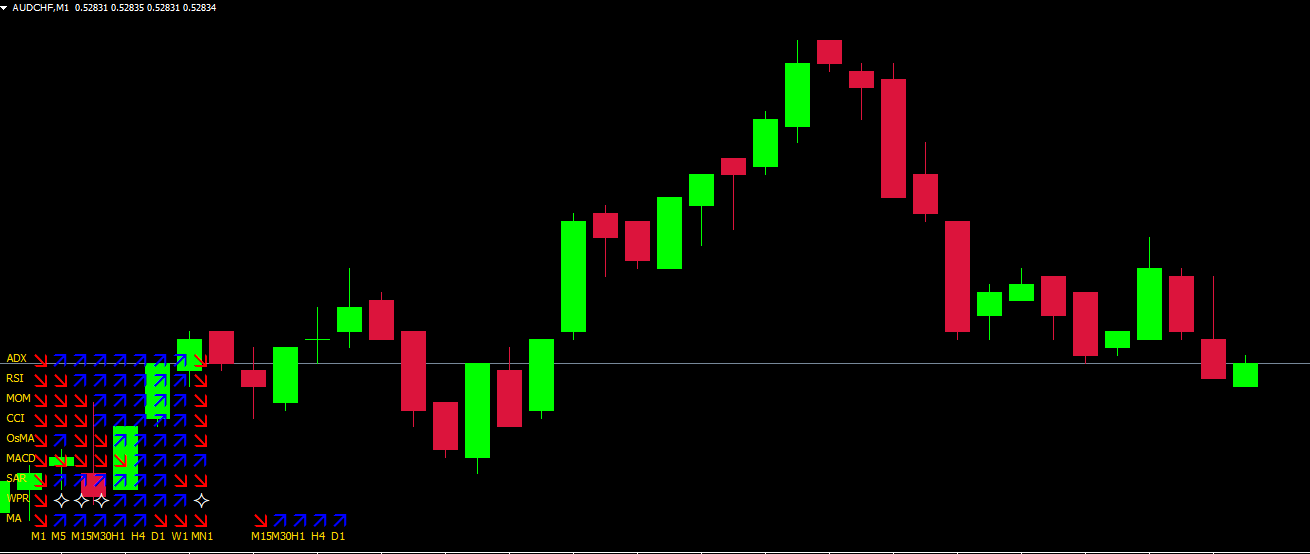
The indicator displays blue and red arrows on the chart — where blue indicates an uptrend and red indicates a downtrend. By combining multiple indicators, the Multi Trend Signal Indicator filters out noise and delivers a more reliable view of the market’s current direction.
How the Multi Trend Signal Indicator Works
Multiple Indicators for Accurate Trend Detection
Unlike most MT4 indicators that rely on a single formula, the Multi Trend Signal Indicator uses a combination of oscillators and trend-based tools. Except for the Moving Average (MA), all the other included indicators are oscillators that help identify overbought and oversold levels, giving traders early warnings before a reversal.
This smart blend of oscillators and trend indicators makes the Multi Trend Signal Indicator suitable for all trading styles — whether you are a scalper, day trader, or swing trader.
Multi-Timeframe Analysis
Another key feature is its multi-timeframe capability. The indicator analyzes price data from 1-minute to 1-month timeframes, allowing traders to see how the trend behaves across different intervals. This means you can apply the same indicator to confirm short-term setups while staying aligned with the overall long-term trend.
For example, if the H4 and Daily charts show blue arrows (uptrend), and the M15 and M30 timeframes also align, it’s a strong confirmation for potential long trades.
How to Use the Multi Trend Signal Indicator in MT4
Apply the Indicator
After installing the indicator in your MT4 terminal, open your desired currency pair or asset. Add the Multi Trend Signal Indicator to the chart — you’ll see multiple colored arrows corresponding to each indicator and timeframe.
Analyze Trend Direction
Blue arrows: Suggest a potential uptrend.
Red arrows: Indicate a possible downtrend.
The more blue or red arrows you see, the stronger the trend confirmation. For example:
If 7 out of 9 indicators show blue arrows → market bias is bullish.
If most show red arrows → the bias is bearish.
Combine with Other Tools
While the Multi Trend Signal Indicator offers strong insights, it should not be used in isolation. Combine it with Price Action, support/resistance levels, or candlestick patterns to reduce false signals and improve entry accuracy.
For instance, if the indicator shows a blue signal while price breaks above a key resistance, it may be a high-probability buy setup.
Advantages of Using Multi Trend Signal Indicator
Combines 9 proven indicators for accurate analysis
Works across all timeframes (from 1M to 1MN)
Easy visual interface with color-coded arrows
Saves time by combining multiple analyses into one view
Versatile for forex, commodities, and indices
Practical Example
Let’s consider the USD/JPY H4 chart:
The indicator plots multiple arrows for different indicators. If the majority show blue, traders can anticipate a bullish move. Conversely, if most arrows turn red, it signals a possible bearish shift.
It doesn’t generate direct buy/sell signals but rather helps confirm the trend direction, empowering traders to make informed trading decisions.
Conclusion
The Multi Trend Signal Indicator for MT4 is an excellent all-in-one trend confirmation tool that combines the strength of nine leading indicators. It’s perfect for traders who want a clearer view of market direction across multiple timeframes without constantly switching charts.
You can download the Multi Trend Signal Indicator for free and start enhancing your trend analysis today at IndicatorForest.com.
3 Downloads
Published:
Nov 03, 2025 09:06 AM
Category: