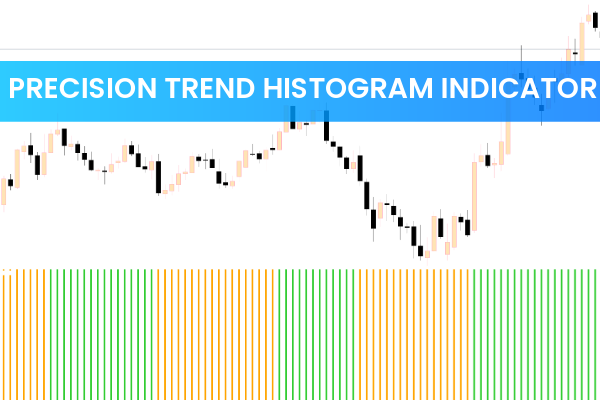
The Precision Trend Histogram is a simple yet effective MT5 indicator designed to report the current trend direction of any financial instrument. By plotting a color-coded histogram in the lower chart window, the indicator allows traders to quickly interpret market trends and make informed trading decisions.
The indicator’s visual simplicity makes it suitable for traders of all levels. It works across any timeframe, though it performs best on longer timeframes, where it filters out minor price fluctuations and reduces false signals.
How the Precision Trend Histogram Works
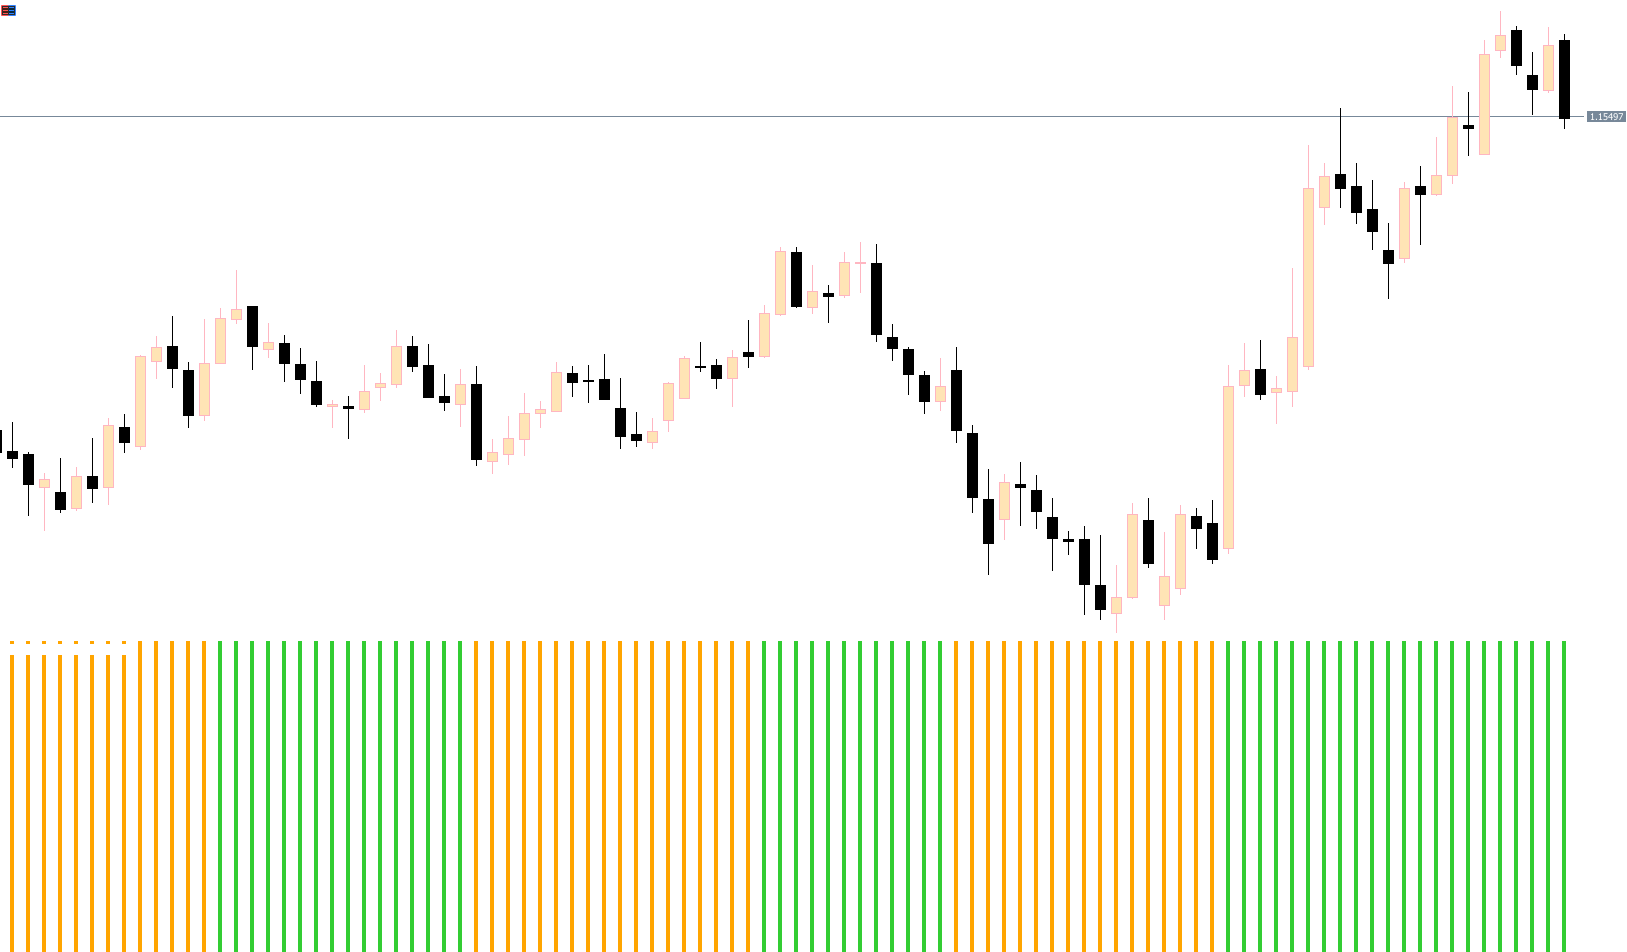
The indicator builds a histogram consisting of two colors:
Green bars → indicate an uptrend, signaling bullish momentum
Orange bars → indicate a downtrend, signaling bearish momentum
Traders can use these bars to determine when to open or close positions, align with the prevailing trend, and anticipate potential reversals.
BUY and SELL Signals
To trade with the Precision Trend Histogram, observe the histogram bars:
Buy Signal: Green bars appear, indicating an uptrend. Traders can open long positions in alignment with the bullish momentum.
Sell Signal: Orange bars appear, indicating a downtrend. Traders can open short positions to follow the bearish trend.
Trend Reversal Detection
When the histogram begins changing colors, it may indicate a trend reversal.
Traders should exit existing positions as the momentum shifts.
Caution: The indicator may not always signal reversals in advance, so confirmation with Price Action or other indicators is recommended.
Best Practices
Timeframe Selection: Use longer timeframes (H1, H4, Daily) for more reliable signals.
Confirmation: While the indicator works independently, combining it with other trend-following or momentum indicators can increase accuracy.
Exit Strategy: Monitor color changes carefully to exit trades before trend exhaustion.
By following these practices, traders can leverage the indicator to stay aligned with the market direction while managing risk effectively.
Conclusion
The Precision Trend Histogram MT5 is a lightweight and easy-to-use trend direction indicator. By plotting green and orange bars, it helps traders identify bullish and bearish trends, spot potential reversals, and make timely trade decisions.
Traders can download the Precision Trend Histogram for free from IndicatorForest.com and start improving their trend analysis today.
FAQ
3 Downloads
Published:
Nov 15, 2025 02:34 AM
Category: