The Chaikin Oscillator for MT5 is a powerful momentum indicator derived from the Accumulation/Distribution Line (A/D Line). It measures the flow of money in and out of a financial instrument, helping forex traders identify shifts in buying and selling pressure. The indicator is calculated by subtracting the 10-period Exponential Moving Average (EMA) from the 3-period EMA of the A/D Line.
By analyzing these values, traders can easily determine whether price momentum is increasing or decreasing. Additionally, the convergence and divergence of the Chaikin Oscillator offer key bullish and bearish trading signals. Whether you’re a beginner or an advanced trader, this tool provides clear visual cues for potential trend reversals.
At its core, the Chaikin Oscillator indicator for MT5 helps confirm price momentum. When the oscillator rises above the zero line, it signals growing buying pressure, suggesting a possible bullish trend. Conversely, when the indicator moves below zero, it indicates increasing selling momentum.
The calculation formula is:
Chaikin Oscillator = 3-period EMA (A/D Line) – 10-period EMA (A/D Line)
This difference highlights short-term momentum shifts against the longer-term trend. As a result, traders gain early insights into possible reversals before they appear on the price chart.
The Chaikin Oscillator for MT5 generates bullish and bearish trading signals through divergences and zero-line crossovers.
Bullish Divergence: Occurs when the price forms a lower low while the oscillator forms a higher low. This suggests weakening selling pressure and a potential upward reversal.
Bearish Divergence: Appears when the price forms a higher high but the oscillator makes a lower high—indicating possible downward momentum.
In both cases, traders should wait for the oscillator to confirm direction by crossing above or below the zero line before entering a trade.
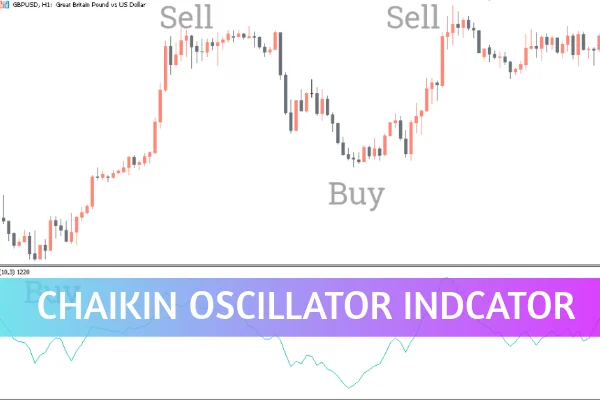
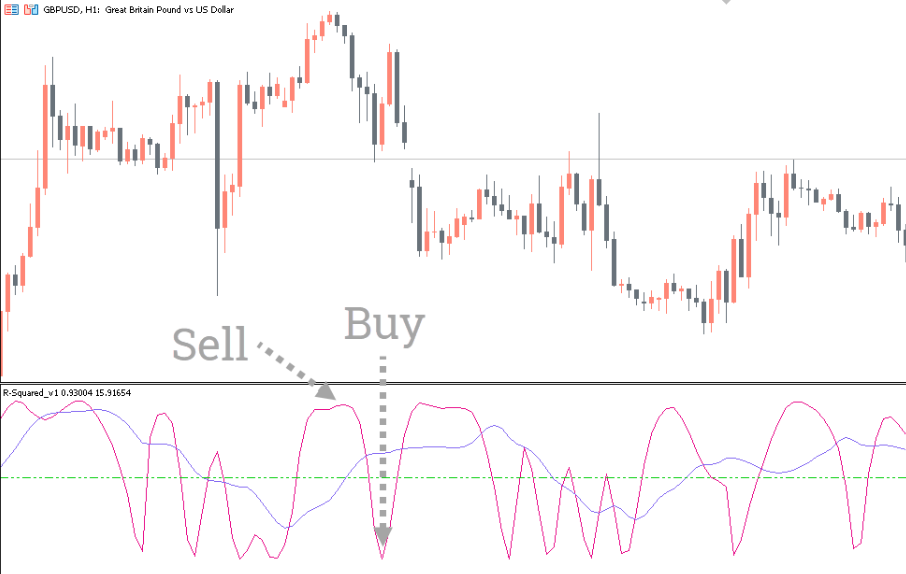
Example: GBP/USD H1 Chart
On the GBP/USD H1 chart, the indicator draws both a zero line and a dark blue oscillator line. When the oscillator crosses above zero after a bullish divergence, a buy signal is generated. Conversely, when it drops below zero following a bearish divergence, a sell signal is confirmed.
For best results, traders should use a stop-loss below the previous swing low (for buy trades) or above the last swing high (for sell trades). Because the indicator doesn’t offer a profit target, applying a fixed risk/reward ratio is recommended.
Although the default settings (3, 10) work well, short-term charts can cause frequent false signals due to market noise. Traders can improve accuracy by adjusting the parameters—for example, using 6 and 10 instead of 3 and 10 to reduce fluctuations around the zero line.
It’s also advisable to apply the indicator on higher time frames (H4, Daily) where price patterns are more stable. Combining the Chaikin Oscillator with other momentum indicators, such as the Relative Strength Index (RSI) or MACD, can further improve signal reliability.
Identifies Momentum Early: Detects strength shifts before trend changes occur.
Simple to Use: Suitable for both beginners and professional forex traders.
Customizable Settings: Flexible input parameters for different market conditions.
Free Download: The Chaikin Oscillator for MT5 is freely available and easy to install from IndicatorForest.com.
The Chaikin Oscillator Indicator for MT5 is a valuable addition to any forex trader’s toolkit. By analyzing the relationship between short- and long-term EMAs of the Accumulation/Distribution Line, it provides accurate insights into market momentum. However, traders should backtest and fine-tune the indicator’s settings to suit their trading style and timeframe.
Ready to enhance your trading strategy? Download the Chaikin Oscillator for MT5 at IndicatorForest.com and start identifying powerful momentum shifts today!
Published:
Oct 24, 2025 15:28 PM
Category: