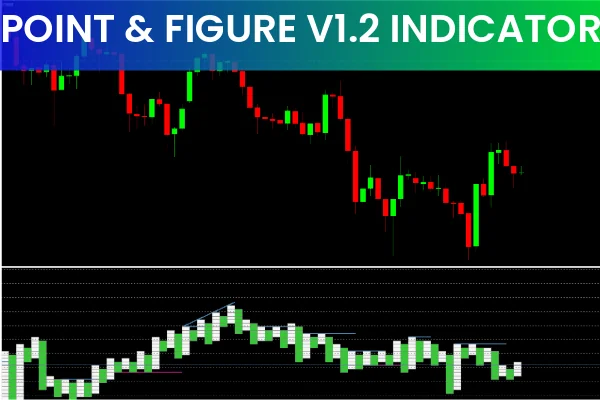
The Point & Figure v1.2 Indicator is a custom MT4 tool built on the classic principles of Point and Figure charting. Unlike traditional candlestick charts that show time-based price movements, Point & Figure focuses purely on Price Action, helping traders identify trend direction more clearly.
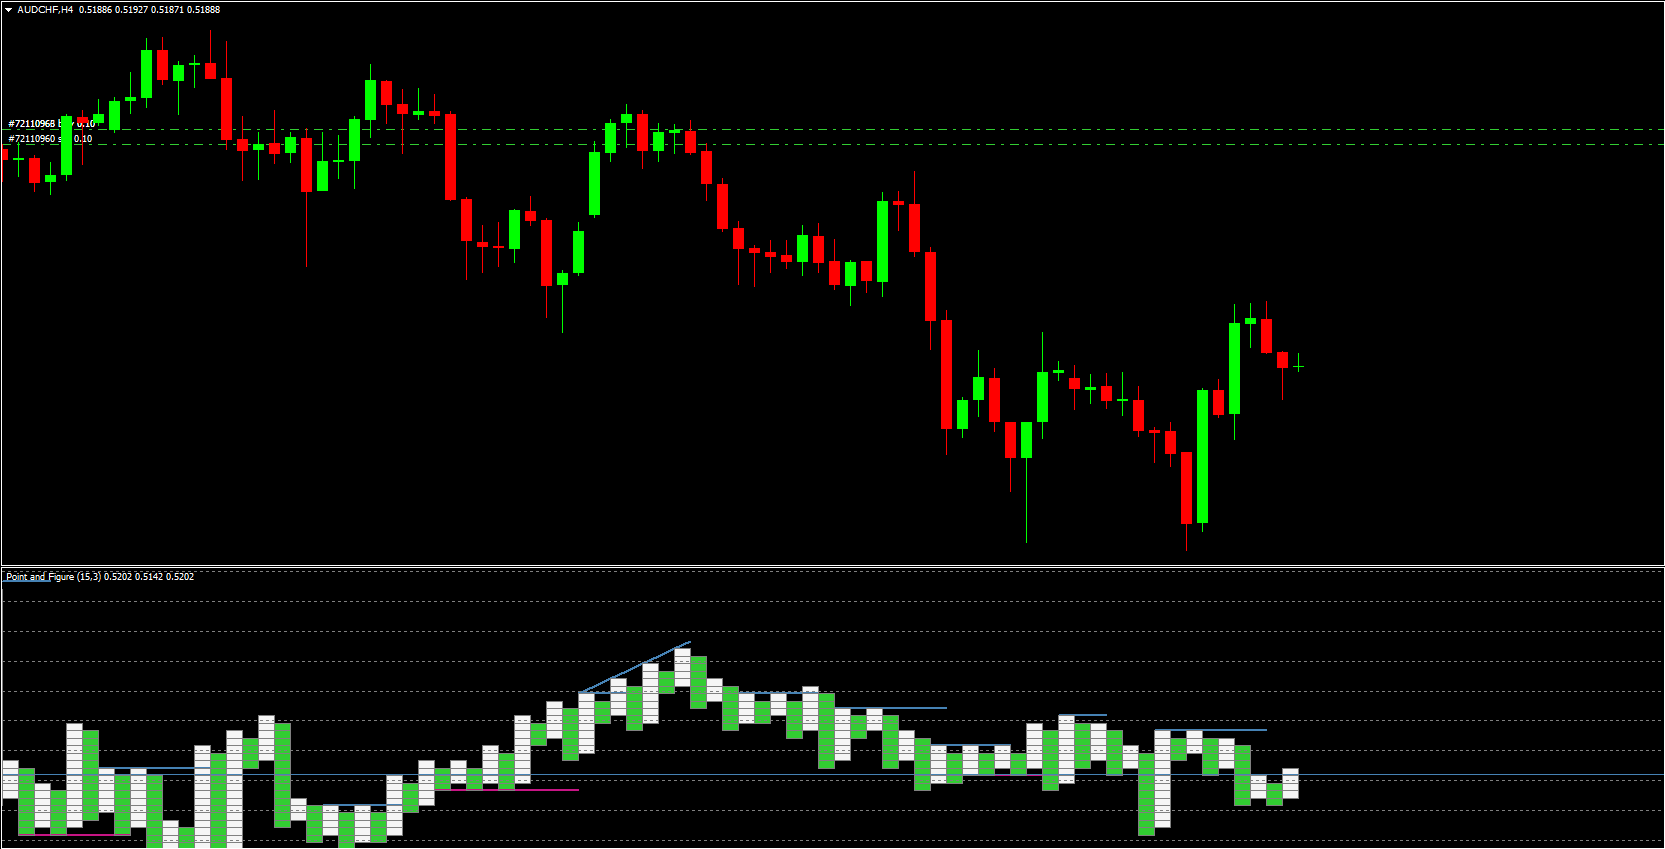
Instead of candles, the indicator draws columns representing bullish or bearish movement. Traditionally these columns are displayed as Xs and Os, but the Point & Figure v1.2 version modernizes the concept by using green and white bars inside a separate sub-window. Alongside these bars, the indicator plots red and blue horizontal levels representing Support And Resistance. Combined, these elements make it easier to detect trend reversals and breakout opportunities.
Because Point & Figure is structure-based rather than time-based, it is most reliable on longer timeframes such as H4 and D1, where false signals are significantly reduced.
How the Point & Figure v1.2 Indicator Works
Green & White Columns for Trend Direction
The indicator visualizes trend momentum using two types of colored bars:
White Bars: Indicate upward momentum. These suggest bullish conditions and potential long opportunities.
Green Bars: Indicate downward momentum, signaling bearish conditions and potential short setups.
These bars allow traders to quickly gauge trend bias without manually analyzing every candle.
Red & Blue Bars for Support and Resistance
A key part of the indicator’s design is its built-in support and resistance levels:
Red Bars: Mark support zones, signaling potential buy opportunities.
Blue Bars: Mark resistance zones, signaling potential sell entries.
These horizontal levels often appear before a reversal or continuation breakout, making them extremely useful for entry timing.
Best Timeframes to Use
The indicator performs best on:
H4
Daily (D1)
Weekly
Shorter timeframes such as M5 or M15 may produce market noise and false signals, which is why traders get better reliability by sticking to higher timeframes.
Point & Figure v1.2 Indicator Buy & Sell Signals (Example: GBP/USD H4)
Buy Signals (Long Entries)
A buy signal occurs when:
Red support bars appear below price
White trend bars show upward movement
Price reacts positively around the support zone
This combination suggests strengthening bullish pressure. Traders can open long positions above the support zone and place stop-losses below the red bars.
Sell Signals (Short Entries)
A sell signal occurs when:
Blue resistance bars appear above price
Green trend bars show bearish momentum
Price rejects the blue resistance level
This indicates downward pressure and a high probability of price reversal. Traders can enter short positions near resistance and place stop-losses above the blue bars.
Confirming With Other Indicators
For better accuracy, traders often combine the Point & Figure v1.2 indicator with:
RSI – To confirm overbought or oversold conditions
MACD – To validate momentum and Trend Continuation
Moving Averages – To confirm long-term directional bias
Using the indicator as part of a multi-tool strategy helps filter out weak setups.
FAQ: Point & Figure v1.2 Indicator
What is a Point and Figure Buy Signal?
A Point & Figure buy signal occurs when the indicator identifies support levels (red bars) and shows upward momentum with white trend bars. This combination indicates an uptrend continuation.
Does Point and Figure Work?
Yes. The Point & Figure v1.2 Indicator is an accurate trend detector that simplifies entry decisions. It works in two major ways:
Detecting support/resistance levels
Identifying trend direction using green and white bars
This makes it effective for breakout strategies, Trend Following, and swing trading.
Conclusion
The Point & Figure v1.2 Indicator is a powerful MT4 tool for detecting Market Structure, support and resistance levels, and trend direction. Using its colored bars and trend columns, traders can easily determine buy and sell zones with improved accuracy. Since the indicator works best on higher timeframes, it helps avoid noise and delivers clearer trading signals. You can download the Point & Figure v1.2 Indicator for free from our website and use it to enhance your technical trading strategy.
FAQ
7 Downloads
Published:
Nov 19, 2025 02:52 AM
Category: