The KVO Indicator for MT4, also known as the Klinger Volume Oscillator, is a custom-built trading tool designed to analyze the volume force behind price movements. While it looks similar to the MACD, its algorithm is entirely different — focusing on the relationship between volume, price trend, and momentum to determine market direction.
The indicator plots a histogram and a signal line, helping traders spot bullish and bearish sentiment shifts. By combining volume analysis with Price Action, the KVO Indicator offers a deeper view of market strength than traditional momentum tools.
How the KVO Indicator Works
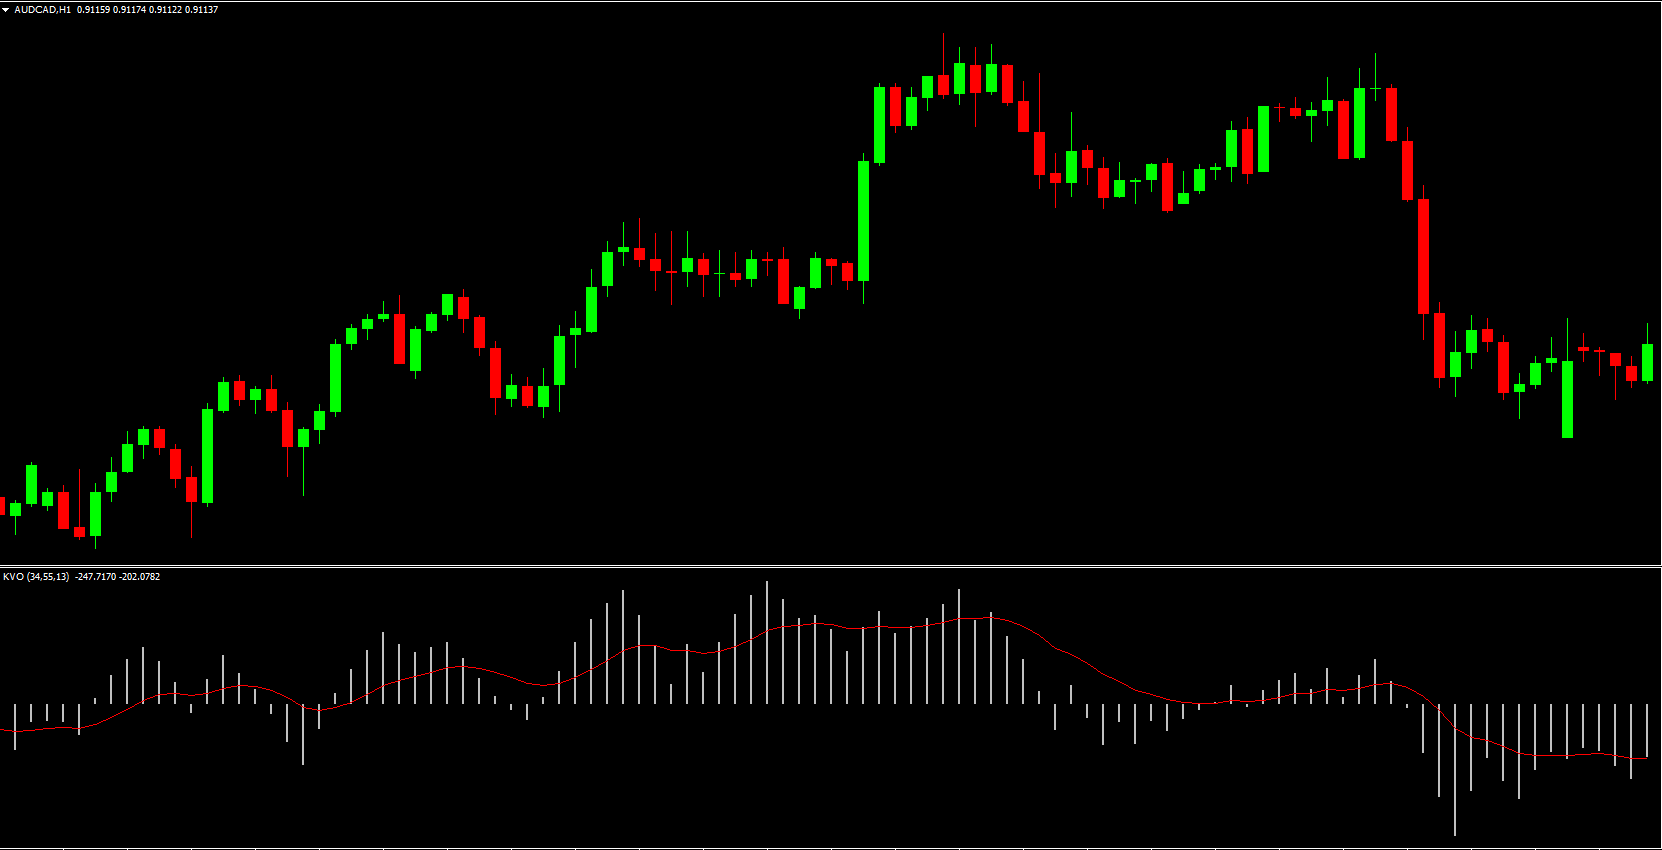
The KVO Indicator calculates the long-term and short-term volume trends and compares them to identify whether buying or selling pressure dominates the market. The results are displayed as histogram bars oscillating around a zero line, with an additional red signal line providing trend confirmation.
Histogram Bars Above Zero → Bullish trend
Histogram Bars Below Zero → Bearish trend
Signal Line Crossing Above Zero → Confirms bullish bias
Signal Line Crossing Below Zero → Confirms bearish bias
This combination of volume and price analysis helps traders understand whether momentum supports the current trend — or if a reversal might be developing.
How to Trade Using the KVO Indicator
The image above shows how the KVO Indicator works on the EUR/USD H4 timeframe. Here’s a step-by-step example of how a high-probability sell signal was identified:
Determine the Trend – The market was in a bearish downtrend, confirmed by lower highs and lower lows on the price chart.
Confirm with KVO – Both the histogram bars and signal line were positioned below the zero line, confirming strong bearish momentum.
Validate with Price Action – Price formed a bearish order block and retested it, providing a clear sell entry zone.
This multi-layered confirmation (trend, volume, and price) creates a powerful trading setup that reduces false signals.
Using the KVO Indicator in Different Trading Styles
The KVO Indicator for MT4 is versatile and can be applied to different trading approaches:
Scalping: Use it on M1–M15 timeframes to capture short bursts of momentum.
Day Trading: Combine with moving averages or RSI on M30–H1 charts to confirm intraday trends.
Swing Trading: Use it on H4–Daily timeframes to identify long-term reversals based on volume pressure.
For best results, traders should combine the KVO with price action or trend indicators like the 200 EMA, RSI, or MACD to enhance signal accuracy.
Why Use the KVO Indicator?
The Klinger Volume Oscillator helps traders see what price alone cannot — the power behind each move. It provides insights into whether the market trend is supported by strong buying/selling volume or is likely to fade soon.
Key Benefits:
Detects true trend direction using volume-based analysis.
Highlights potential reversal zones early.
Works well in both trending and ranging markets.
Suitable for all trading styles (scalping, day trading, swing trading).
Completely free to download and use on MetaTrader 4.
Conclusion
The KVO Indicator for MT4 (Klinger Volume Oscillator) is a reliable and easy-to-use tool for identifying market trends and reversals. By comparing volume dynamics with price direction, it gives traders a clear picture of the underlying strength of a move.
Ideal for both beginners and experienced traders, the KVO is especially useful for scalpers and day traders who rely on quick, accurate confirmations. Use it together with price action and other indicators to improve your trade timing and decision-making.
Download the KVO Indicator for MT4 now on IndicatorForest.com and start analyzing market volume like a pro.
FAQ
3 Downloads
Published:
Nov 08, 2025 20:46 PM
Category: