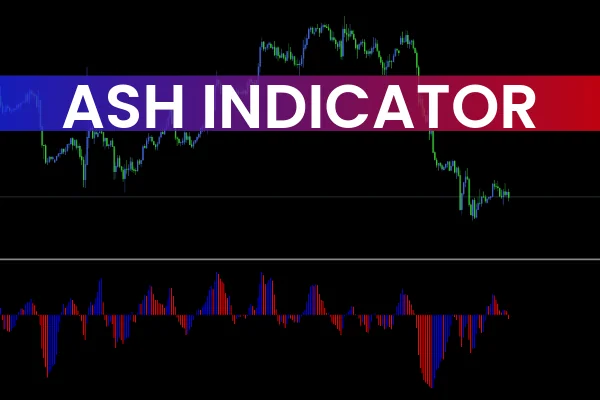
The MetaTrader ASH Indicator, also known as the Absolute Strength Histogram, is a powerful trend-following indicator designed to display the bullish and bearish momentum of an asset. Found in many forex trading systems, the ASH Indicator combines the best features of Moving Averages, Stochastics, and RSI, providing traders with an easy-to-read histogram and two colored signal lines.
On IndicatorForest.com, traders can download and learn to use the ASH Indicator for MetaTrader 4 (MT4) and MetaTrader 5 (MT5). The tool helps detect market strength and potential reversals with high accuracy.
How the MetaTrader ASH Indicator Works
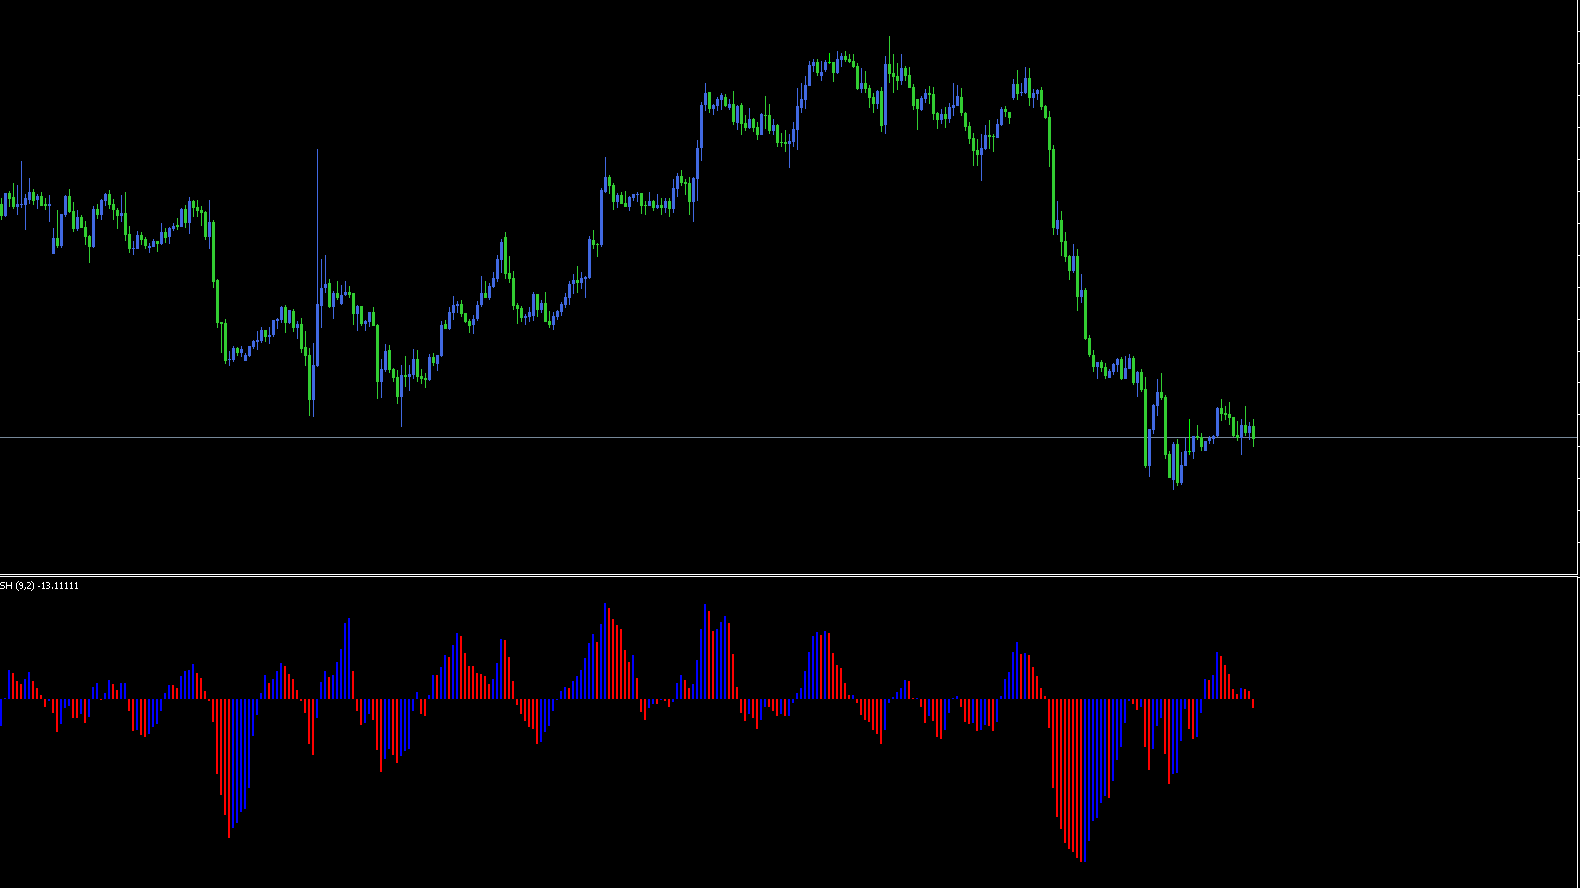
The ASH Indicator uses green and red moving averages as signal lines. When the green line crosses above the red one, it suggests a bullish move. Conversely, when the red line crosses above the green one, it signals a bearish trend.
Below these signal lines lies a histogram that represents the overall strength of the current market direction.
Green histogram bars = bullish momentum
Red histogram bars = bearish momentum
This visual combination allows traders to confirm the trend’s strength before making entry or exit decisions.
Why Use the ASH Indicator in Forex Trading
The MetaTrader ASH Indicator is suitable for traders of all levels — beginners, intermediate, and advanced. It’s also highly effective for Scalping, day trading, and swing trading.
Key benefits include:
Identifying trend reversals early
Avoiding false signals when combined with Price Action
Measuring the relative strength of market momentum
Simplifying chart analysis with color-coded visualization
However, traders should avoid using it as a standalone tool. The ASH Indicator performs best when combined with Support And Resistance zones, Candlestick Patterns, or other technical indicators such as MACD or RSI.
How to Trade Using the MetaTrader ASH Indicator
To trade effectively using the ASH Indicator, follow this step-by-step method:
Identify the crossover: Wait for the green moving average to cross the red line upward (bullish signal) or downward (bearish signal).
Confirm with the histogram: Check if the histogram bars are turning green for bullish momentum or red for bearish momentum.
Analyze price action: Look for a bullish engulfing candle to enter a buy trade, or a bearish engulfing candle to enter a sell trade.
Set stop-loss and take-profit: Place your stop-loss below/above the recent swing low/high, and set your take-profit based on the next key support/resistance level.
This strategy filters out false breakouts and increases your win rate, especially in trending markets.
Tips for Best Results
Combine the ASH Histogram with indicators like Bollinger Bands or ADX for enhanced accuracy.
Avoid trading during low volatility sessions.
Always test the indicator on a demo account before applying it to live trades.
Remember, no indicator is 100% accurate — combining it with sound risk management is crucial.
Conclusion
The MetaTrader ASH Indicator is an essential momentum and trend-following tool for forex traders. Its clear visualization of bullish and bearish strength helps identify trend direction and reversals effectively.
However, traders should not rely solely on moving average crossovers for entry signals, as false signals may occur during consolidation periods. Instead, confirm trades using price action and volume indicators for the best outcomes.
You can download the ASH Indicator for free and explore more advanced trading tools at IndicatorForest.com.
2 Downloads
Published:
Nov 02, 2025 12:44 PM
Category: