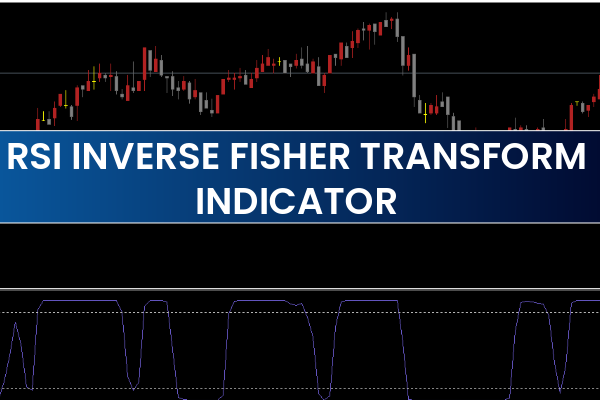
The RSI Inverse Fisher Transform Indicator for MetaTrader 5 (MT5) is a powerful technical analysis tool that enhances the classic Relative Strength Index (RSI) by applying smoothing techniques and a Fisher Transform filter. This combination makes the indicator more responsive, more precise, and less prone to false signals than the standard RSI.
Designed to highlight optimal entry and exit points, this indicator works across all timeframes, from intraday charts (M1, M5, H1) to long-term charts (Daily, Weekly, Monthly). Whether you’re a beginner or an experienced trader, the RSI Inverse Fisher Transform provides a clearer view of overbought and oversold market conditions, helping traders make smarter, data-driven decisions.
How the RSI Inverse Fisher Transform Works
The RSI Inverse Fisher Transform Indicator takes the conventional RSI formula and applies two major enhancements:
Smoothed Price Input:
Instead of calculating RSI directly from raw price data, the indicator first applies a moving average to smooth out market noise.
Fisher Transform Application:
The Fisher Transform is a mathematical technique that compresses price fluctuations into a standardized range, typically between -1 and +1. When combined with RSI, it enhances the visibility of turning points and potential reversals.
This hybrid approach helps identify market extremes more accurately and reduces the lag that often plagues standard oscillators.
How to Trade Using the RSI Inverse Fisher Transform Indicator
The indicator plots a colored oscillator line in a subwindow beneath the main MT5 chart. It displays three dotted threshold levels — representing oversold, neutral, and overbought zones.
Blue Line: Indicates overbought conditions — price may reverse downward soon.
Red Line: Indicates oversold conditions — price may reverse upward soon.
Dull Gray Line: Represents neutral conditions, signaling a potential transition or early entry opportunity.
Buy Signal Setup
Wait for the oscillator line to enter the oversold zone (colored red).
Once the color changes from red to dull gray, this signals the end of downward pressure.
Enter a BUY trade after the gray transition.
Stop Loss: Below the most recent swing low.
Take Profit: Use a 1:2 or better risk/reward ratio, or exit on an opposite (blue) signal.
Sell Signal Setup
Wait for the oscillator to reach the overbought zone (colored blue).
When it changes from blue to dull gray, bearish momentum is forming.
Enter a SELL trade after confirmation.
Stop Loss: Above the latest swing high.
Take Profit: Use a minimum 1:2 risk/reward ratio or close on the next opposite signal.
Tip: Combine the indicator with Trend Confirmation tools like Moving Averages or MACD for improved accuracy. Only take buy trades in uptrends and sell trades in downtrends.
Multi-Time Frame (MTF) Trading
A standout feature of the RSI Inverse Fisher Transform Indicator is its multi-time frame (MTF) capability.
You can:
Display RSI Inverse Fisher Transform values from higher timeframes (like H4 or D1) on a lower timeframe chart (such as M15 or H1).
Use this to confirm trend direction and filter false signals.
For example:
If the H4 timeframe shows an oversold condition while the M15 chart gives a BUY signal, this confluence increases trade accuracy.
Best Settings and Parameters
While default settings work well for most traders, advanced users can fine-tune parameters:
RSI Period: Controls sensitivity (typical: 14)
MA Period: Smoothing level before RSI calculation
Fisher Coefficient: Adjusts the intensity of the Fisher transformation
Overbought/Oversold Levels: Typically set at +0.8 and -0.8
Experiment with settings to match your preferred trading style — Scalping, day trading, or swing trading.
Advantages of Using the RSI Inverse Fisher Transform Indicator for MT5
Smooths market noise for cleaner RSI readings
Generates more accurate overbought/oversold signals
Works on all timeframes and all market instruments
Non-repainting and MTF compatible
Suitable for both beginners and advanced traders
Free to download and install on MT5
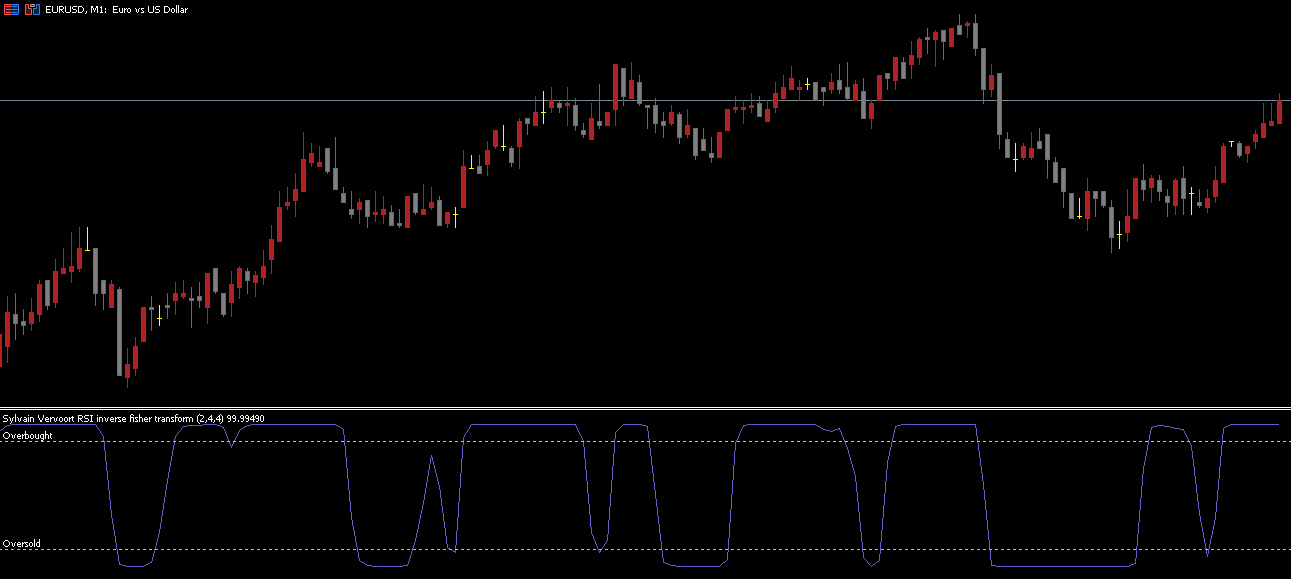
Trading Example
In the example of the EUR/USD H4 chart, the RSI Inverse Fisher Transform oscillator shows multiple transitions between red (oversold) and blue (overbought) zones. When the color shifts from red to dull gray, price typically begins to rise — a reliable BUY signal. Conversely, when the oscillator shifts from blue to dull gray, a SELL opportunity often follows.
Using this strategy with trendline confirmation or moving average filters can further improve performance and consistency.
Conclusion
The RSI Inverse Fisher Transform Indicator for MT5 is an advanced yet user-friendly oscillator that combines moving averages, RSI, and the Fisher Transform to provide traders with precise market timing.
By highlighting overbought and oversold zones with color-coded signals, it simplifies complex analysis and helps traders execute high-probability trades confidently. Whether you trade scalping, day trading, or swing strategies, this indicator is an excellent addition to your MT5 toolkit.
You can download the RSI Inverse Fisher Transform Indicator for free on IndicatorForest.com and start improving your entry timing today.
FAQ
3 Downloads
Published:
Nov 06, 2025 15:21 PM
Category: