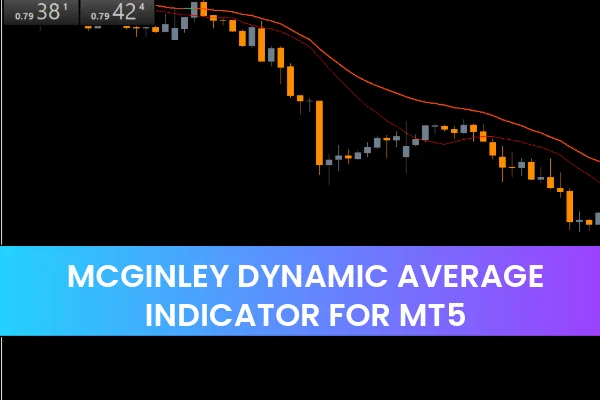
The McGinley Dynamic Average Indicator for MT5 is a highly efficient trend-following tool that helps traders identify market direction with precision. Unlike traditional moving averages, the McGinley Dynamic Average adjusts itself according to price speed, reducing lag and providing more responsive trend signals. By comparing the current price position to the dynamic trendline, traders can quickly assess whether the market is bullish, bearish, or in a consolidation phase.

Using a single dynamic trendline is particularly helpful for beginners, as it simplifies decision-making. Traders only need to monitor whether the price is above or below the indicator to align their trades with the prevailing trend. This reduces the complexity of trading systems and improves reaction time during fast market movements.
The McGinley Dynamic Average automatically adjusts to the speed of price movements. Unlike simple moving averages (SMA) that lag behind, or exponential moving averages (EMA) that may produce false signals, the McGinley method maintains a more accurate representation of market trends. It reacts quickly to changes in momentum while smoothing out minor market noise.
Uses a default 12-period moving average, adjustable for sensitivity.
Provides a dynamic support/resistance level for trend entries.
Reacts to real-time price action to help traders catch early trend reversals.
Ideal for intraday and day trading across forex, stocks, and indices.
A potential buy signal occurs when:
The price moves above the McGinley Dynamic Average line.
Confirmation is received from the next candle breaking the high of the bullish breakout.
The price respects the indicator slope, using it as a dynamic support during trending markets.
Waiting for confirmation reduces the risk of entering during false breakouts and improves the probability of capturing sustained trend moves.
A valid sell setup happens when:
The price falls below the McGinley Dynamic Average line.
The following candle confirms the breakout by moving lower.
The dynamic average acts as a resistance line during downward trends.
By combining breakout signals with trend slope confirmation, traders can minimize the risk of premature entries.
The McGinley Dynamic Average Indicator can be applied across multiple timeframes:
M1-M30 for scalping and intraday trading
H1-H4 for swing and day trading
Daily charts for longer-term trend analysis
Its adaptability makes it suitable for both beginner and experienced traders.
The dynamic nature of the indicator ensures quicker response to trend changes compared to traditional moving averages, making it ideal for short-term trading.
Beginners can quickly determine market direction by observing whether the price is above or below the indicator line, reducing the need for multiple indicators.
The indicator line acts as a dynamic support/resistance level, allowing traders to better time entries and exits based on trend continuation or reversal.
The McGinley Dynamic Average Indicator for MT5 is a versatile and powerful tool for traders looking to follow trends with precision. Its dynamic adjustment to price speed reduces lag, provides accurate signals, and acts as a real-time support/resistance line. Whether used for forex, stocks, or indices, this indicator is suitable for beginners and professionals alike. Incorporating it into your trading strategy can improve decision-making, minimize false signals, and help capture profitable market moves.
Download the McGinley Dynamic Average Indicator for MT5 today and enhance your trend trading performance. For more premium MT4 and MT5 tools, visit IndicatorForest.com.
Published:
Nov 16, 2025 04:09 AM
Category: