The Market Structure Oscillator (MSO) by LuxAlgo is a sophisticated hybrid trading indicator that merges market structure analysis with cyclical momentum detection. Unlike traditional oscillators that focus solely on overbought or oversold conditions, MSO integrates price structure into the oscillator window.

This allows traders to visualize directional strength across short, intermediate, and long-term timeframes simultaneously. By interpreting market structure and momentum together, the MSO helps traders spot trend reversals, confirm entries, and avoid false breakouts — a critical advantage in fast-moving markets.
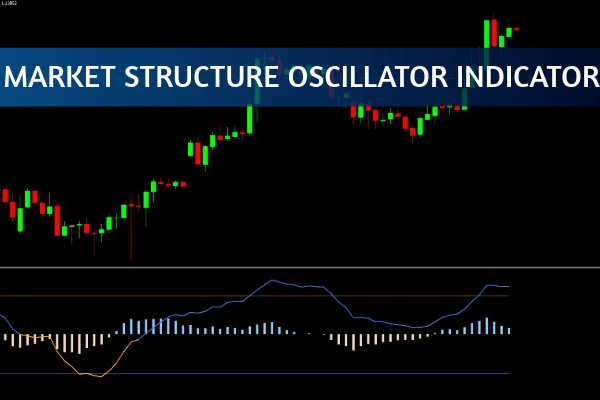
The MSO displays bullish trends in blue shades and bearish trends in orange or wheat tones. As the histogram grows and the MSO line rises above the midpoint, it signals increasing bullish momentum. Conversely, when the histogram contracts and the MSO line dips below the midline, bearish sentiment strengthens.
This visual format allows traders to instantly gauge market balance and momentum shifts, even without analyzing candlestick charts in detail.
One of the most powerful aspects of the MSO is its cycle oscillator — a complementary tool designed to detect market rhythm and timing-based reversals. It reveals when price action is losing steam or preparing for a new move, helping traders anticipate trend shifts before they occur.
The combination of structure and cycle within a single oscillator provides an unmatched perspective, reducing noise and improving decision-making accuracy.
The Market Structure Oscillator provides real-time trading signals derived from both momentum and structural analysis.
Bullish Signals:
When the MSO line rises above the midpoint and the histogram expands upward, traders can interpret this as a strong bullish continuation signal.
Bearish Signals:
When the MSO line drops below the midline while the histogram contracts, bearish pressure is increasing — signaling potential downward movement.
Reversal Detection:
The cycle oscillator component identifies rhythm-based reversals, helping filter out false breakouts and choppy conditions. This multi-layered confirmation system is especially powerful in multi-timeframe trading.
Traders can understand how short-term cycles align with long-term trends, ensuring better trade synchronization.
By merging price structure with momentum flow, the MSO avoids misleading readings that are common with standard oscillators.
The visual simplicity of the indicator allows for quick interpretation without sacrificing analytical depth — perfect for scalpers, swing traders, and even institutional analysts.
Identify the dominant market structure — whether bullish or bearish.
Confirm momentum alignment using the oscillator’s histogram and midline behavior.
Check for cycle oscillator turns to anticipate reversals.
Combine MSO signals with price action setups or support/resistance zones for higher confluence.
This approach helps you make objective, data-backed trading decisions without overcomplicating your charts.
The Market Structure Oscillator Indicator is a versatile tool for traders who want to blend price structure and momentum cycles in one efficient framework. Developed by LuxAlgo, it offers multi-timeframe clarity, precision, and ease of interpretation — helping traders make confident, informed moves in any market condition.
If you’re serious about improving your technical analysis and trading accuracy, explore more expert indicators like the Market Structure Oscillator at IndicatorForest.com.
Published:
Oct 28, 2025 15:13 PM
Category: