Mastering Market Cycles with the TMA Slope True Indicator
In the world of technical analysis, the Triangular Moving Average (TMA) is revered for its extreme smoothness. However, standard TMA indicators often suffer from "repainting," which can mislead traders by changing past signals. The TMA Slope True Indicator is the professional solution to this problem, offering a non-repainting, real-time look at price momentum and Trend Strength.
What is the TMA Slope True Indicator?
The TMA Slope True Indicator is a momentum oscillator that measures the rate of change (the slope) of a Triangular Moving Average. While a standard TMA is essentially a double-smoothed simple moving average, the "Slope True" version calculates the incline or decline of that average to determine the intensity of a trend.
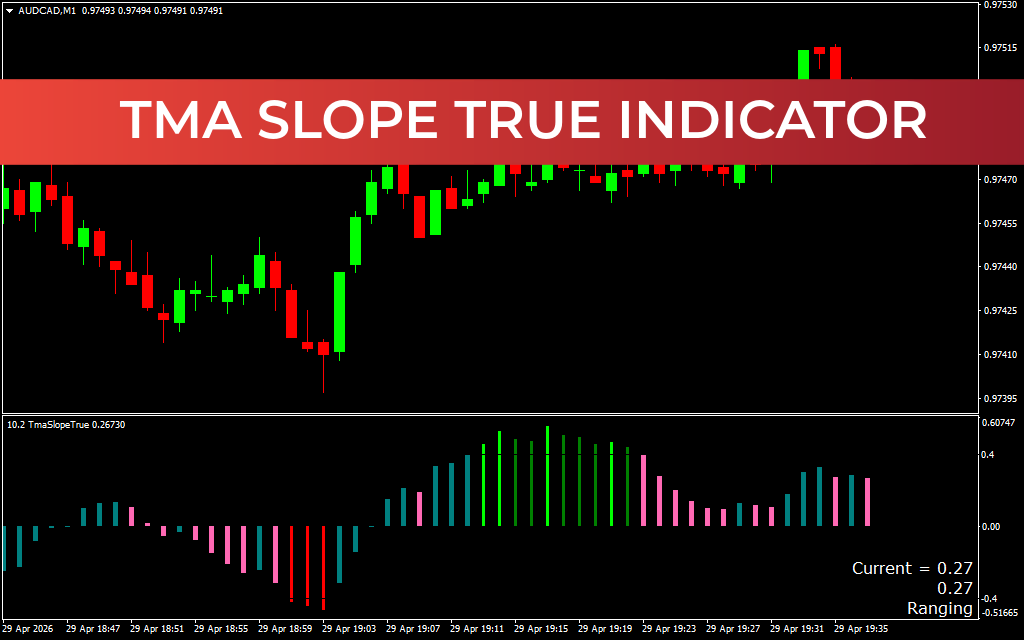
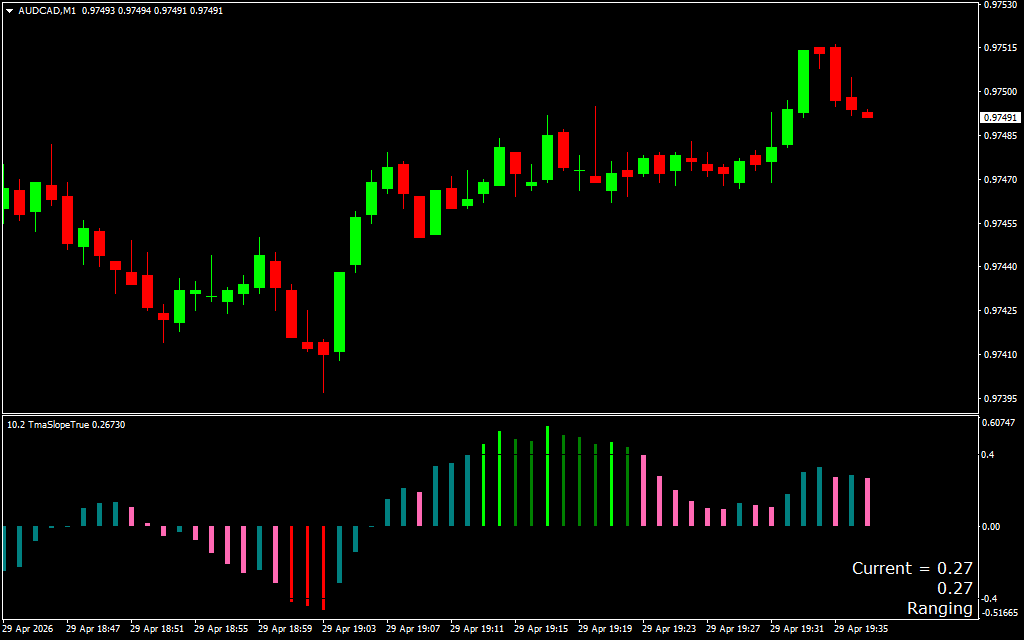
The indicator typically appears in a sub-window as a histogram that fluctuates around a zero line.
- Rising Histograms above zero indicate strengthening bullish momentum.
- Falling Histograms below zero indicate strengthening bearish momentum.
- Colors usually change to reflect the acceleration or deceleration of the trend, providing a "heatmap" of market conviction.
Key Features of TMA Slope True
- Non-Repainting Logic: Unlike "centered" TMA indicators, the "True" version ensures that once a bar is closed, it stays fixed. This makes it a reliable tool for backtesting and live execution.
- Extreme Smoothing: Because it is based on the Triangular Moving Average, it filters out almost all market "noise," showing you the clean, underlying cycle of the Price Action.
- Divergence Detection: It is one of the best tools for spotting momentum divergence, where the price makes a new high but the TMA Slope makes a lower high, signaling a coming reversal.
- Trend Intensity Mapping: By measuring the angle of the slope, it tells you not just if the market is moving, but how fast it is moving.
Strategic Application: Trading the Slope
The TMA Slope True is most effective when used to identify "exhaustion" and "acceleration" points:
- Zero-Line Crossovers: A classic entry signal occurs when the histogram crosses from negative to positive (Buy) or positive to negative (Sell). This indicates a fundamental shift in the market's mid-term cycle.
- The "Slope Peak" Exit: If you are in a long trade and the green histogram bars begin to shorten (darken), it suggests the trend's velocity is slowing down. This is often a signal to tighten stop-losses or take partial profits.
- Slope as a Filter: Use a long-period TMA Slope on a higher timeframe (like H4). Only take intraday trades in the direction of the higher-timeframe slope to ensure you are trading with the "big money" flow.
Why Traders Prefer TMA Slope True
Most oscillators are too "jittery," giving off too many false signals in sideways markets. The TMA Slope True Indicator provides a calm, stabilized view of the market. It allows traders to stay in winning trades longer by ignoring minor fluctuations, focusing instead on the actual mathematical slope of the price trend.
13 Downloads
Last Update:
Apr 29, 2026 22:38 PM
Published:
Oct 24, 2025 23:09 PM
Category: