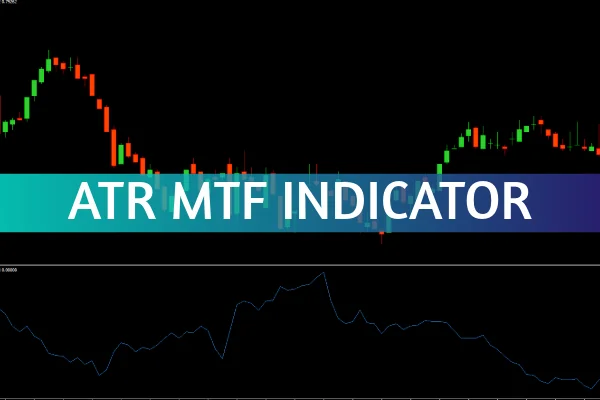
Trading in the foreign exchange market requires more than just luck—it demands insight, precision, and the right tools. The ATR MTF Indicator (Average True Range Multi-Timeframe) is one such essential tool that simplifies volatility analysis for traders. By combining the Average True Range (ATR) data from multiple timeframes into a single chart, it allows you to clearly see how volatility behaves across different market conditions.
At IndicatorForest.com, we specialize in professional trading indicators like the ATR MTF that help traders make more informed decisions.
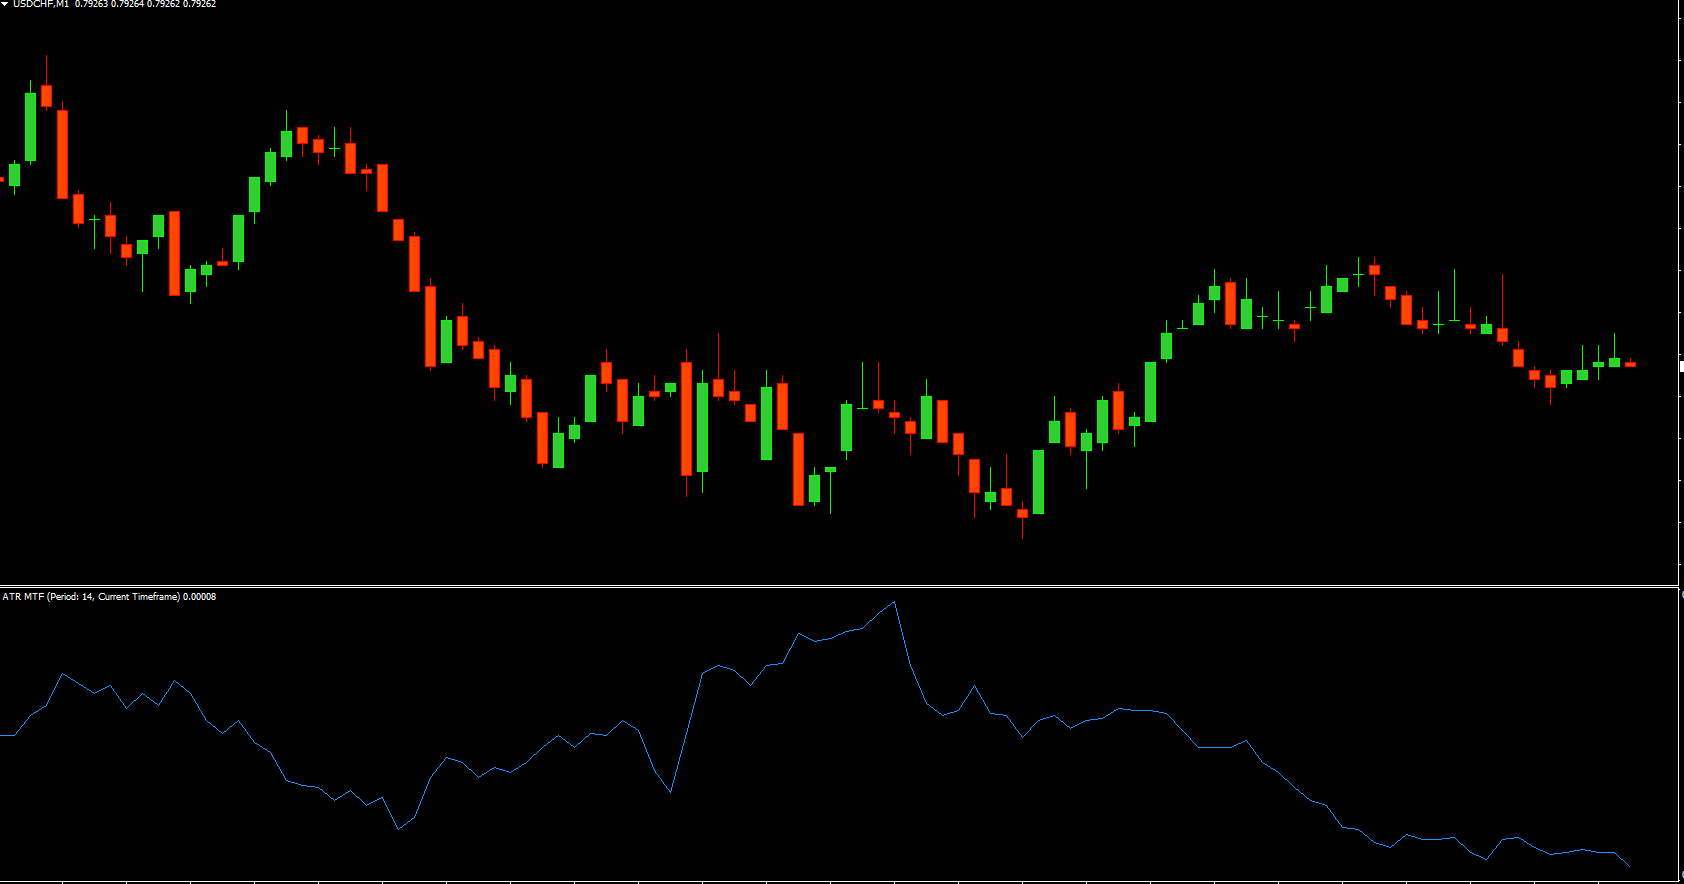
The ATR MTF Indicator is designed to calculate and display the Average True Range from several timeframes on your current chart. This means you can see volatility from higher or lower timeframes without constantly switching charts.
For instance, you can compare the ATR on the 1-hour, 4-hour, and daily charts all at once. This multi-timeframe visualization helps you gauge whether the market is calm, trending, or about to experience a breakout.
The concept behind the ATR MTF stems from the original Average True Range developed by J. Welles Wilder Jr. It measures market volatility by averaging the true range over a specified period. The MTF version simply expands this capability across different timeframes, enhancing your situational awareness.
Multi-Timeframe Volatility Display
The indicator overlays ATR readings from various timeframes on a single chart, allowing for instant multi-layer analysis.
Customizable Settings
Adjust the timeframes, colors, and smoothing parameters to suit your strategy. Whether you’re a scalper or swing trader, customization ensures relevance.
Quick Volatility Insights
The ATR MTF Indicator instantly highlights periods of high or low volatility—crucial for setting accurate stop-loss and take-profit levels.
Seamless Chart Integration
The indicator works efficiently on MT4, MT5, and other popular platforms, providing smooth integration into your trading workflow.
Volatility is the heartbeat of the forex market. Understanding it helps traders optimize entry and exit points and manage risk. The ATR MTF Indicator brings several benefits:
Enhanced Risk Management:
By observing volatility across timeframes, you can size your trades more effectively and set stops that align with real market behavior.
Better Entry Timing:
When short-term and long-term volatility align, it may indicate stronger price movement. Traders can capitalize on these moments for better entries.
Reduced Chart Switching:
Multi-timeframe analysis is faster and cleaner, as you no longer need to open multiple windows to compare volatility levels.
In simple terms, the ATR MTF Indicator helps smooth out your trading experience by giving a clearer picture of market rhythm.
Use the ATR MTF when you want to:
Detect volatility spikes that often precede breakouts.
Identify quiet periods signaling possible consolidations.
Adjust your stop-loss distance based on recent volatility.
Analyze multi-timeframe conditions before entering trades.
By including volatility insights from multiple timeframes, the indicator allows for a more comprehensive and strategic approach to trading decisions.
Whether you’re new to trading or an experienced professional, understanding volatility is crucial. The ATR MTF Indicator is your all-in-one solution for visualizing market dynamics and improving trade accuracy.
👉 Download the ATR MTF Indicator today at IndicatorForest.com and take your market analysis to the next level.
Published:
Oct 20, 2025 05:49 AM
Category: