The Time Segmented Volume Indicator for MT4 is a powerful technical analysis tool that measures the flow of money into and out of a security over a set period. By comparing price movements with corresponding volume, the TSV Indicator helps traders identify divergences, potential reversals, and confirm ongoing trends.

Unlike basic volume indicators, TSV emphasizes how volume correlates with price over time, offering a deeper look into the strength behind a price movement. Whether you’re a beginner or a seasoned trader, this indicator provides valuable insights into market dynamics, helping refine your entries and exits.
How the Time Segmented Volume (TSV) Indicator Works
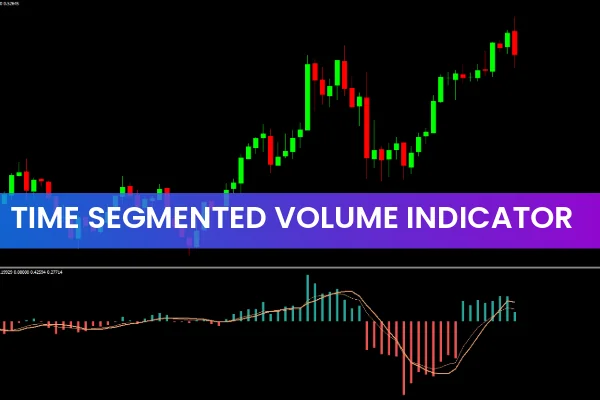
The TSV Indicator plots a histogram and a signal line, where green and red bars indicate the direction of volume flow.
Green Bars: Positive volume flow, suggesting buying pressure and a potential upward move.
Red Bars: Negative volume flow, signaling selling pressure and possible downward momentum.
When the TSV line crosses above its moving average, it often marks the beginning of an upward trend — a buy signal. Conversely, when the TSV line drops below its average, it may indicate a sell signal.
This visual representation allows traders to quickly gauge whether volume is confirming or contradicting Price Action, which is crucial in spotting divergence signals that precede market reversals.
Benefits of Using the TSV Indicator for MT4
Volume-Based Confirmation of Trends
Volume plays a vital role in confirming the validity of price movements. The TSV Indicator helps you assess whether a trend is supported by sufficient trading activity — an essential factor in avoiding false breakouts.
Versatility Across Time Frames
Whether you’re a scalper, day trader, or swing trader, the TSV Indicator for MT4 adapts to any trading style. It can be applied on short-term charts (like 5-minute or 15-minute) as well as longer time frames for more strategic analysis.
Early Detection of Reversals
By tracking divergences between price and TSV, traders can detect early signs of potential reversals. For example, if price continues to rise while TSV begins to fall, it may indicate weakening buying pressure — a warning of an upcoming correction.
Complements Other Indicators
To enhance accuracy, combine TSV with moving averages, RSI, or the MACD. Doing so provides multiple confirmations, improving your decision-making in both trending and sideways markets.
Practical Application: How to Trade with the TSV Indicator
Install the TSV Indicator on MT4
After downloading from IndicatorForest.com, install the TSV Indicator in your MT4 platform by copying it into the Indicators folder, then restart the platform.
Identify Crossovers and Volume Strength
Watch for crossovers between the TSV line and its moving average:
Bullish crossover (TSV line moves above average) → potential buy opportunity.
Bearish crossover (TSV line moves below average) → potential sell opportunity.
Confirm with Other Tools
Combine TSV signals with other trend indicators or support/resistance levels to validate entries. This reduces false signals, especially in volatile or ranging markets.
Example Trading Strategy Using TSV
Let’s say EUR/USD shows a bullish TSV crossover with strong green bars. You might enter a buy position, placing a stop-loss below the recent swing low. If TSV continues to rise with volume confirmation, it strengthens your trade’s conviction.
However, if TSV starts declining while price continues rising, it’s a sign of bearish divergence, signaling a potential exit point or reversal.
Pro Tips for Maximizing TSV Accuracy
Use higher time frames for stronger confirmation of major trends.
Avoid relying on TSV alone — always use it in combination with trendlines or moving averages.
Keep your chart clean and focus on TSV crossovers with clear volume momentum.
Conclusion
In summary, the Time Segmented Volume (TSV) Indicator for MT4 is a must-have tool for traders who want to better understand how price and volume interact. It helps detect Trend Strength, divergences, and reversals, making it a versatile addition to any trading toolkit.
Start enhancing your trading strategy today by downloading the TSV Indicator from IndicatorForest.com — your trusted source for professional MT4 and MT5 trading tools.
Published:
Nov 01, 2025 13:32 PM
Category: