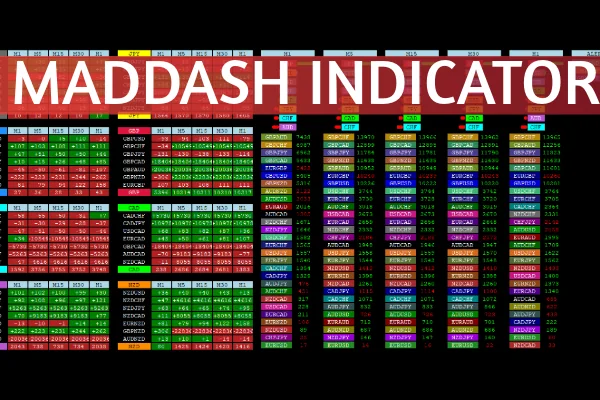
The MADdash Indicator for MT4 (Moving Average Distance Dashboard) is a powerful MetaTrader 4 tool that visually displays the relative strength of currency pairs across multiple timeframes. Unlike traditional single-pair indicators, MADdash provides a comprehensive overview of market conditions by calculating the distance between moving averages for each pair.
Displayed as a colorful heatmap dashboard, it allows traders to instantly identify the strongest and weakest currencies, making it easier to find high-probability trading setups. Whether you trade trends, reversals, or scalping strategies, MADdash gives a clear picture of overall market momentum.
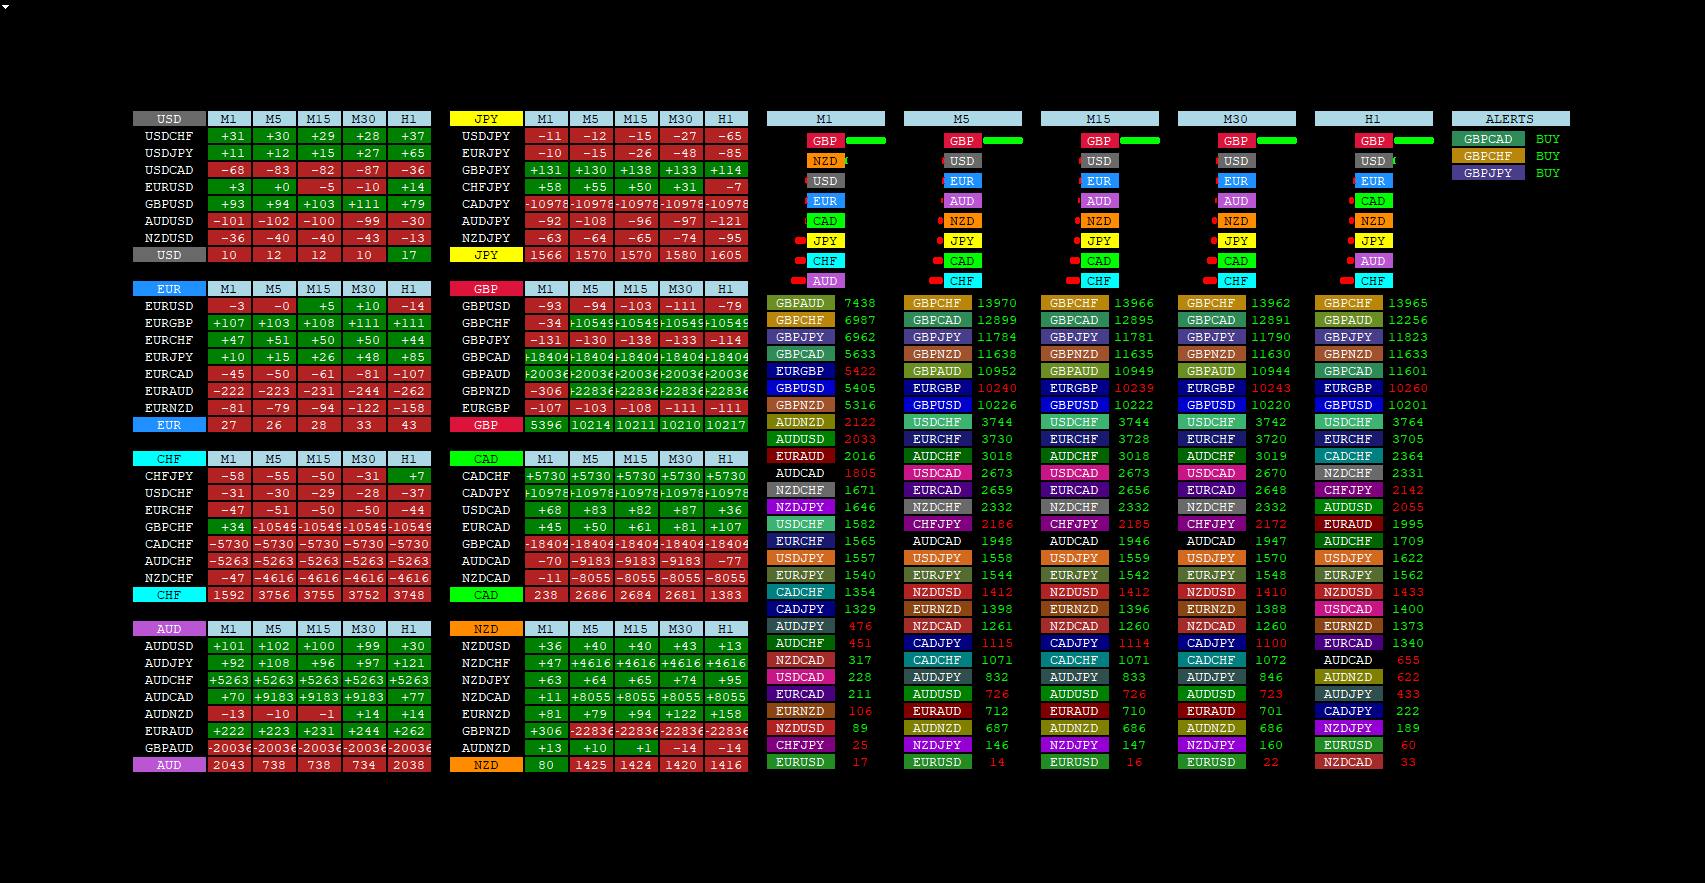
The MADdash Indicator calculates the difference between a currency pair’s price and its smoothed moving averages across various timeframes. Each pair and timeframe combination is shown as a cell within the dashboard, color-coded to represent bullish or bearish strength.
Green cells: Indicate strong bullish momentum.
Red cells: Represent bearish pressure.
Neutral colors: Suggest consolidation or indecision.
This system allows traders to compare relative strengths quickly — for example, if EUR and GBP show consistent green values while USD pairs display red, it indicates Euro and Pound dominance over the U.S. Dollar.
When a currency pair shows positive MADdash values across multiple timeframes, it signals strong bullish momentum. Such conditions often indicate an opportunity for long trades or trend-following setups.
Conversely, negative MADdash readings across timeframes represent sustained bearish strength, favoring short positions.
Trend Confirmation
When one currency (e.g., GBP) consistently appears strong across several pairs, and another (e.g., JPY) shows weakness, combining the two (GBP/JPY) often yields the strongest trending opportunities.
MADdash automatically sorts and color-codes its readings, making it easy to spot trend continuations or reversal zones. This visual approach enhances situational awareness across the forex market.
Multi-Timeframe Scanning: Analyze up to nine timeframes simultaneously.
Customizable Parameters: Adjust moving averages, smoothing, and colors.
Real-Time Dashboard: Instantly updates to reflect current market conditions.
Currency Grouping: View performance by base currency for fast trend identification.
Heatmap Visualization: Quickly spot market strength and weakness without chart clutter.
The MADdash for MT4 helps traders:
Save time by scanning all major pairs from one dashboard.
Identify correlations and divergence between currencies.
Confirm entries and exits based on relative market strength.
Combine with other tools like RSI or MACD for enhanced accuracy.
By providing both speed and insight, MADdash supports smarter trading decisions for scalpers, swing traders, and even position traders.
Combine MADdash with a trend-following indicator (e.g., Moving Average or ADX) for confirmation.
Focus on pairs where strength and weakness are clearly separated across timeframes.
Use higher timeframes to confirm direction and lower ones for entry timing.
The MADdash Indicator for MT4 is a must-have tool for traders who want to analyze multiple pairs efficiently. Its intuitive heatmap design, real-time strength readings, and flexible customization make it one of the best dashboards for forex traders. Whether you’re monitoring macro movements or fine-tuning short-term entries, MADdash provides an edge in understanding the market’s pulse.
Visit IndicatorForest.com to download the MADdash Indicator and explore more powerful MT4 tools that can enhance your trading strategy.
Published:
Oct 30, 2025 02:03 AM
Category: