The Linear Regression Channel Cloud indicator for MT5 is a highly responsive trading tool that automatically draws multiple regression channels on a chart. Designed for both trend-following and breakout strategies, it helps traders identify potential Support And Resistance zones and anticipate price movements in real-time.
What are Regression Channels?
A regression channel is a technical analysis tool that consists of:
Axial Line: The central trend line of the channel.
Parallel Upper & Lower Lines: Equidistant lines acting as dynamic support and resistance.
The channel’s slope indicates the market trend:
Upwards slope: Bullish trend
Downwards slope: Bearish trend
The Linear Regression Channel Cloud indicator continually updates its channels as trends evolve, making it suitable for Scalping, intraday, and swing trading.
How to Trade with Linear Regression Channel Cloud
Trend Continuation
Identify the lower boundary of the channel in an uptrend.
When the price tests and rejects the lower zone, it signals a potential buy opportunity.
Stop-loss can be placed slightly below the lower channel line, while take-profit can target the upper line.
Breakout Trading
Observe when the price breaks above or below a channel line.
Wait for a retest of the broken line as it becomes a new support or resistance.
Enter a trade in the direction of the breakout after confirmation.
For example, on a GBPUSD M15 chart, the price breaking out of a bullish channel and retesting the upper line may indicate a bearish reversal, signaling a potential sell opportunity.
Advantages of Linear Regression Channel Cloud
Dynamic Channel Drawing: Continuously updates as trends develop.
Multi-Timeframe Support: Suitable for scalping, intraday, and swing trading.
Trend & Breakout Identification: Works for both continuation and reversal strategies.
Support and Resistance Zones: Upper and lower lines act as actionable trade levels.
Free to Use: Available for immediate download and implementation in MT5.
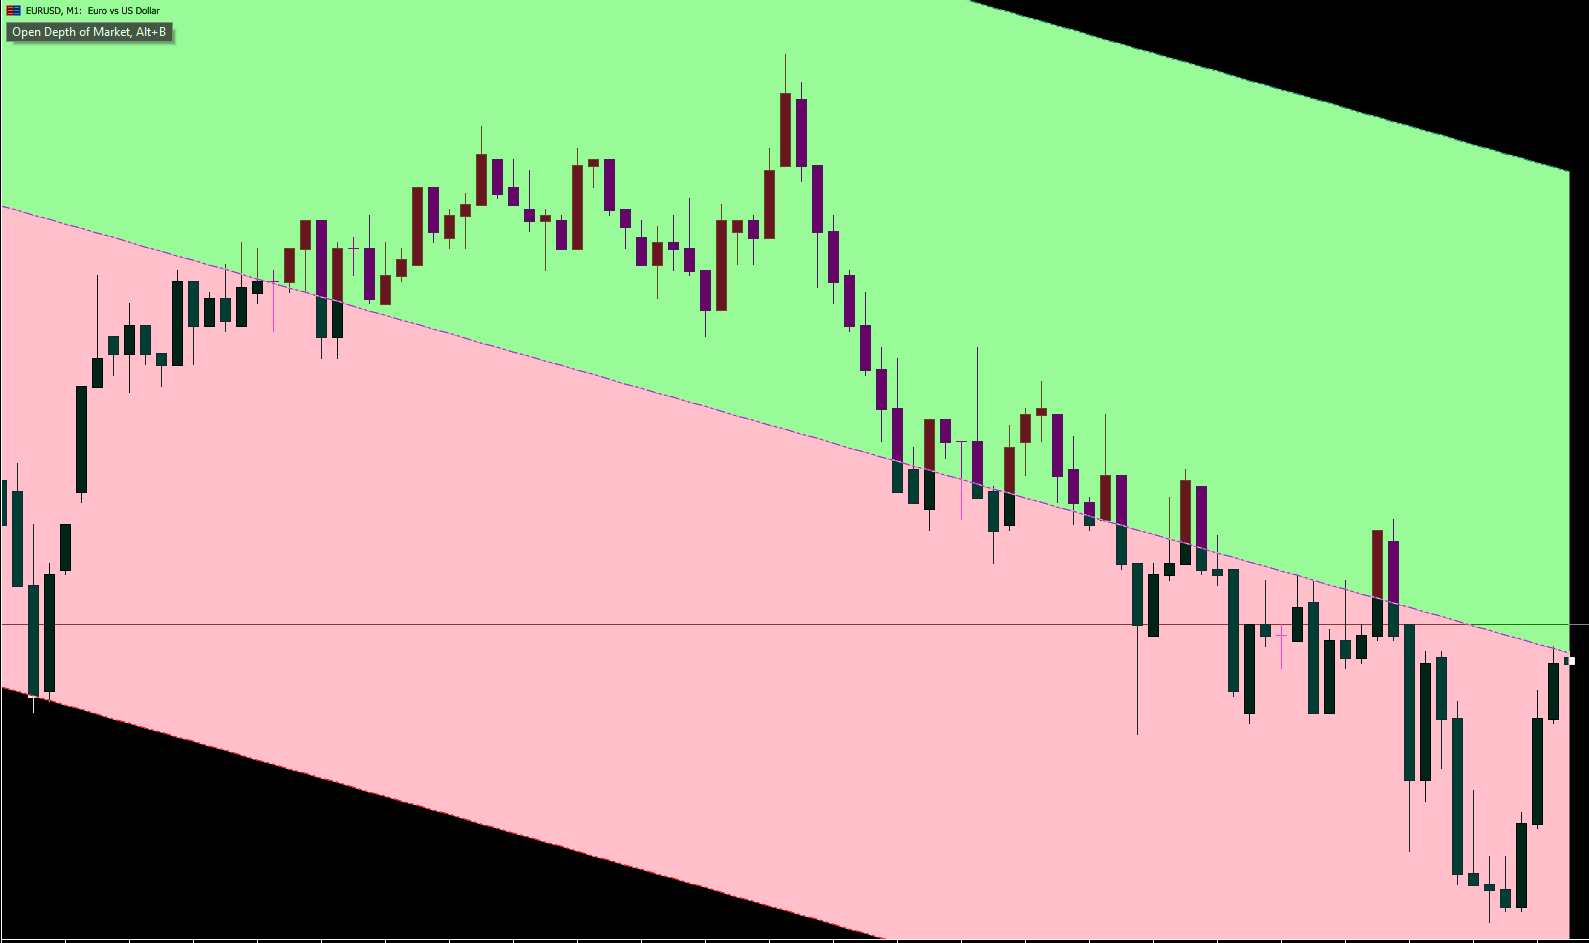
The image above shows the action of the indicator on the GBPUSD currency pair on the M15 timeframe. For example, it shows how to find trading opportunities with the indicator in an uptrend.
The image shows how the price has rejected the wick several times in the lower zone of the indicator, which, in turn, means a potential bullish continuation (buy signal).
The image above shows how to use the indicator to identify trading opportunities when the price breaks out of the channel. It shows how the price of the GBPUSD currency pair broke out of the bullish channel and retested it before turning to the downside (bearish).
The play here is based on the concept that a resistance zone is more likely to act as support after the price breaks it and retests it.
Conclusion
The Linear Regression Channel Cloud Indicator for MT5 is a trading tool that automatically draws regression channels on your chart. Moreover, it is suitable for scalping, day/intraday and swing trading. Finally, it’s free to download.
FAQ
1 Download
Published:
Nov 23, 2025 04:06 AM
Category: