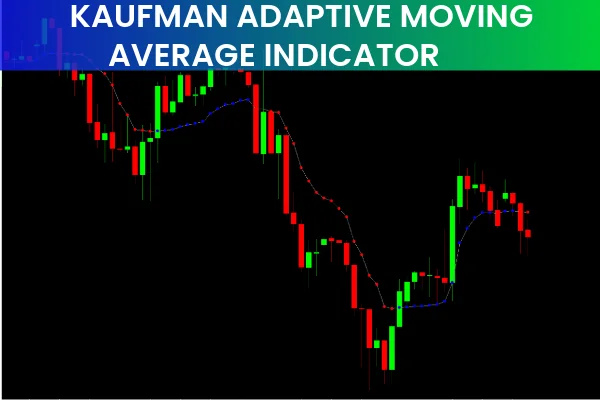
The Kaufman Adaptive Moving Average Indicator is a powerful MT4 technical tool that helps traders identify market direction with improved accuracy. This Kaufman Adaptive Moving Average Indicator, often referred to as KAMA, adapts to changing market volatility, giving forex traders clearer signals compared to standard moving averages. Its ability to react sensitively to recent price movements makes it an excellent choice for pinpointing trend shifts, entries, and exits.
What Is the Kaufman Adaptive Moving Average Indicator?
The Kaufman Adaptive Moving Average (KAMA) was developed by Perry Kaufman to reduce noise and better follow the actual market trend. Unlike traditional moving averages that apply equal smoothing throughout market conditions, KAMA adjusts based on price efficiency.
When the market trends strongly, KAMA becomes more responsive
When price movement is choppy, it becomes more stable and smooth
This makes the KAMA ideal for both short-term scalpers and long-term trend followers.
How the Indicator Works in MT4
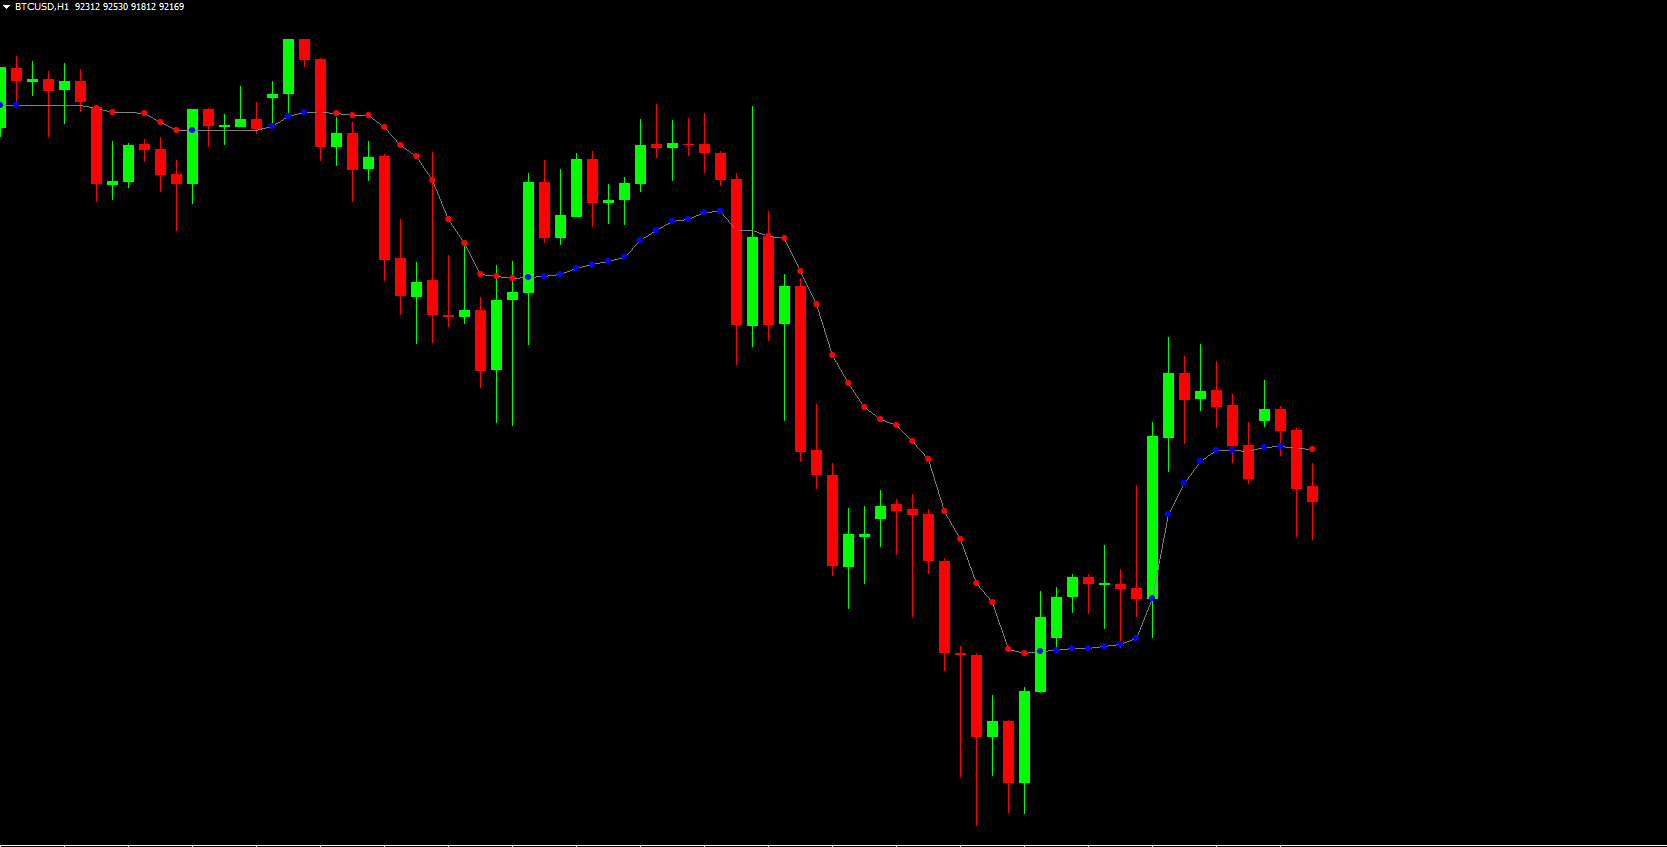
The Kaufman Adaptive Moving Average Indicator for MT4 plots a 10-period adaptive moving average and includes red and blue dots along the signal line. These dots represent bearish and bullish sentiment:
Blue dots → indicate an uptrend
Red dots → indicate a downtrend
Because it reacts to volatility, KAMA filters out unnecessary noise, helping traders make cleaner, more confident decisions.
Why KAMA Is More Reliable Than Traditional Moving Averages
Standard moving averages lag because they use fixed smoothing values. KAMA, however:
Prioritizes recent price changes
Adjusts dynamically to price efficiency ratio
Smooths out price swings more effectively
Reduces false signals in sideways markets
This balance of responsiveness and stability makes the indicator an excellent tool for identifying legitimate buy/sell setups.
Kaufman Adaptive Moving Average BUY/SELL Signals
To generate actionable trading signals, traders simply observe the colored dots:
BUY Signal
Identify blue dots on the KAMA line.
Wait for price to continue moving upward.
Enter long positions once the trend confirms.
SELL Signal
Spot red dots forming on the chart.
Allow price to continue moving downward.
Enter short positions after confirmation.
Dealing With Mixed Signals
Sometimes KAMA may temporarily plot red dots in an uptrend or blue dots in a downtrend. This usually occurs during periods of consolidation. In these cases:
Be patient
Wait for price to resume its directional movement
Enter trades only after clear continuation
This approach helps avoid entering the market prematurely.
How to Use the Kaufman Indicator Effectively
To use the indicator, traders only need to monitor the color-coded dots and the slope of the adaptive moving average. By combining KAMA with additional tools—such as RSI, support/resistance levels, or volume indicators—traders can increase accuracy and reduce false entries.
KAMA works on all timeframes, from M1 to D1, making it suitable for Scalping, intraday trading, swing trading, and position trading.
Easy to understand for beginners
Smooths out noise without losing trend accuracy
Great for volatile markets
Enhances entry and exit clarity
Works with any currency pair or asset
The intuitive design makes it accessible even for traders who are new to using technical indicators.
Conclusion
The Kaufman Adaptive Moving Average Indicator for MT4 offers an adaptive and reliable approach to trend identification. Its dynamic smoothing, along with the helpful red and blue dot system, helps traders clearly see bullish and bearish movements. You can download this indicator and explore many others at IndicatorForest.com, where more tools and forex resources are available.
FAQ
2 Downloads
Published:
Nov 18, 2025 20:58 PM
Category: